


A vector MBTiles viewer that works in your browser
An MBTiles file is a whole tiled map packed into one file. Inside is a small SQLite database: one table with the tiles, one with information about them. Vector MBTiles files hold Mapbox Vector Tiles, compact binary tiles with roads, buildings, rivers, boundaries and their attributes, ready to be styled by a map app. They are made by tools such as tippecanoe, Planetiler, OpenMapTiles and QGIS, and they power a lot of offline and self-hosted MBTiles maps.
The trouble starts when you want to look inside. Your computer cannot open the file, the usual image viewers see nothing, and most online viewers only show raster tiles. To see a vector MBTiles file you normally need a tile server, a style and some JavaScript, or a full GIS program. This vector MBTiles viewer online skips all of that: drop the file in, and it reads the database, decodes the vector tiles in your browser and draws every layer on a map with its own colour.
It is built as a checking tool as well as a viewer. You can click any feature to read its attributes, switch layers on and off, see how big the tiles are at each zoom level and which tiles are the largest, and run a set of checks against the MBTiles and vector tile specifications. When you are done, export the features in view as GeoJSON, save a PNG of the map, or download a technical report you can send to a colleague or a client. My take: run the checks before you put a tileset on a server. Most "my map is blank" problems are a missing metadata row or a wrong zoom range, and they are much easier to fix before deployment.
What the vector MBTiles viewer does
Here is everything the tool does, in the order you will meet it.
- Open the file. Drag a .mbtiles file onto the map or click "Open MBTiles". Files up to 300 MB open in the browser with the SQLite engine sql.js. "Try a sample" loads a small world tileset with countries, lakes, rivers and cities, so you can see the tool working right away.
- See the map at once. The tool reads the bounds and center from the metadata and zooms to the data. Every layer is drawn on a canvas in its own colour: polygons as light fills, lines as strokes, points as dots. Common layer names such as water, landuse, building, transportation and place get natural colours.
- Work with the layers. The Layers tab lists every layer from the metadata and from the tiles, with its geometry types, the number of features in a sample and all its fields with an example value. Tick layers on and off, press "Only" to look at one layer by itself, or click the colour square to pick your own colour.
- Click to inspect features. Click the map and a card shows every feature at that spot in the visible layers: layer, geometry type, ID and all attributes. The feature is highlighted on the map, and you can copy it as GeoJSON or download the whole tile as a raw .pbf file.
- Read the file info. The File info tab shows the metadata in plain words: name, description, attribution, version, format, compression, zoom range, bounds, center, the generator (for example tippecanoe) and the size of the file and of the tile data.
- Check the tiles. The Tiles tab gives the number of tiles, the total, average and largest size for each zoom level, and the ten largest tiles in the file. Click "Show" to jump to a tile. The tile grid option draws every tile border with its z/x/y and size.
- Run the checks. The Checks tab tests the file: tiles table, metadata, format, compression, the json vector_layers list, layers missing from the metadata, bounds, center, the zoom range against the real tiles, tiles over 500 KB and attribution. Each check is marked OK, warning or error with a plain explanation.
- Zoom past the data. Vector tiles stay sharp when you zoom in beyond the last zoom level, so the viewer keeps drawing the deepest tiles enlarged ("overzoom"). Below the first zoom level, a note tells you to zoom in.
- Adjust the display. Change the fill opacity and line width, switch place labels on or off, and add a street or satellite base map for orientation. With no base map, nothing is loaded from other servers at all.
- Export. Download the visible features as GeoJSON, the map view as PNG, the metadata as JSON, or a technical report with the checks, layers, fields, tile statistics and recommendations.
The file is read with JavaScript and WebAssembly inside your browser tab. It is never uploaded, so the viewer is safe for private or licensed data.
How to view a vector MBTiles file, step by step
A real example with the sample world tileset (Natural Earth data, zoom 0 to 5).
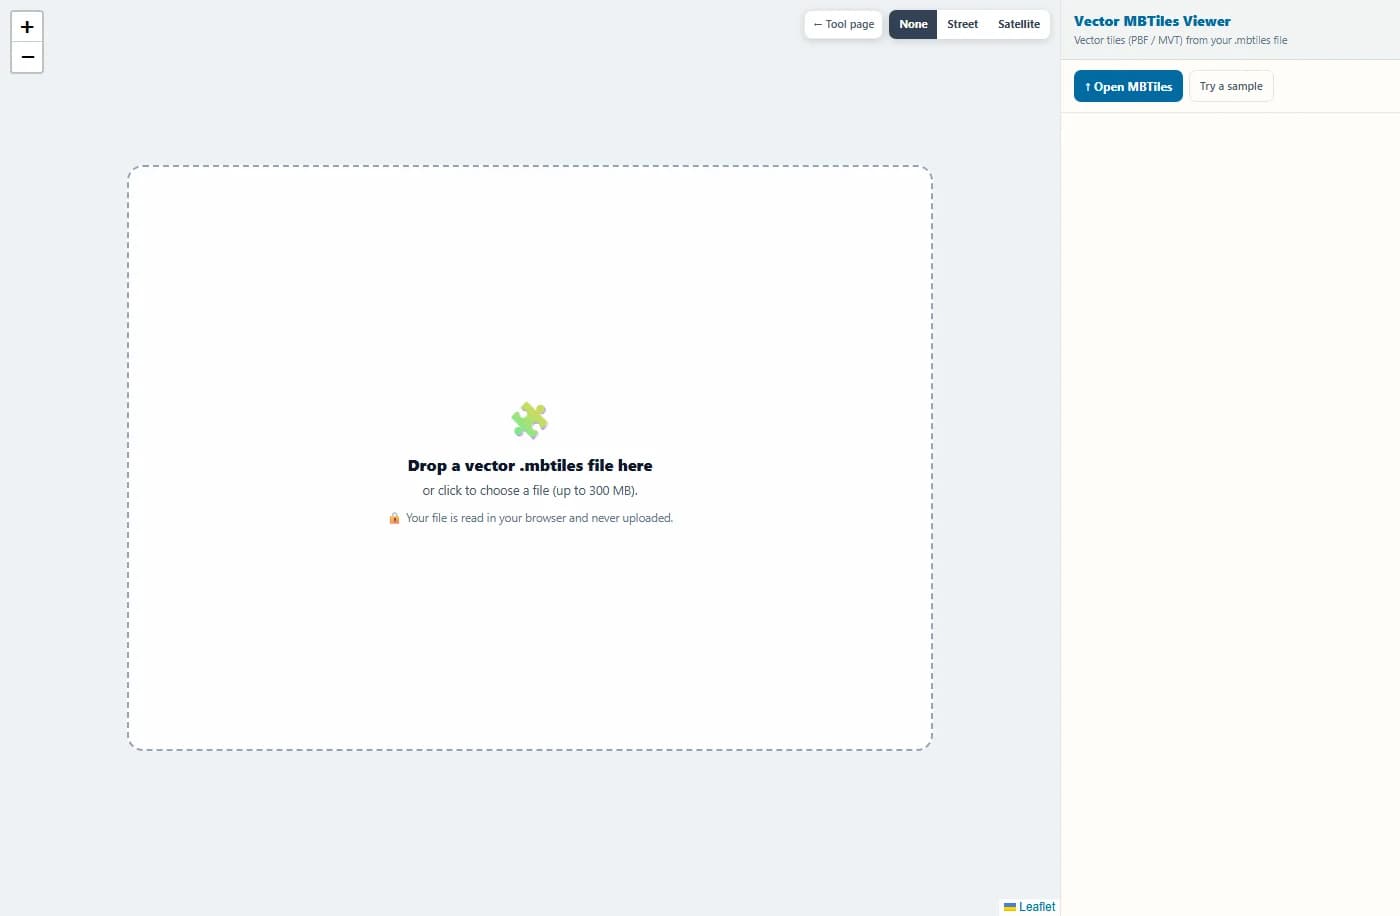
The tool opens with an empty map and a drop area. Drag your .mbtiles file onto it, click to choose a file, or press "Try a sample".
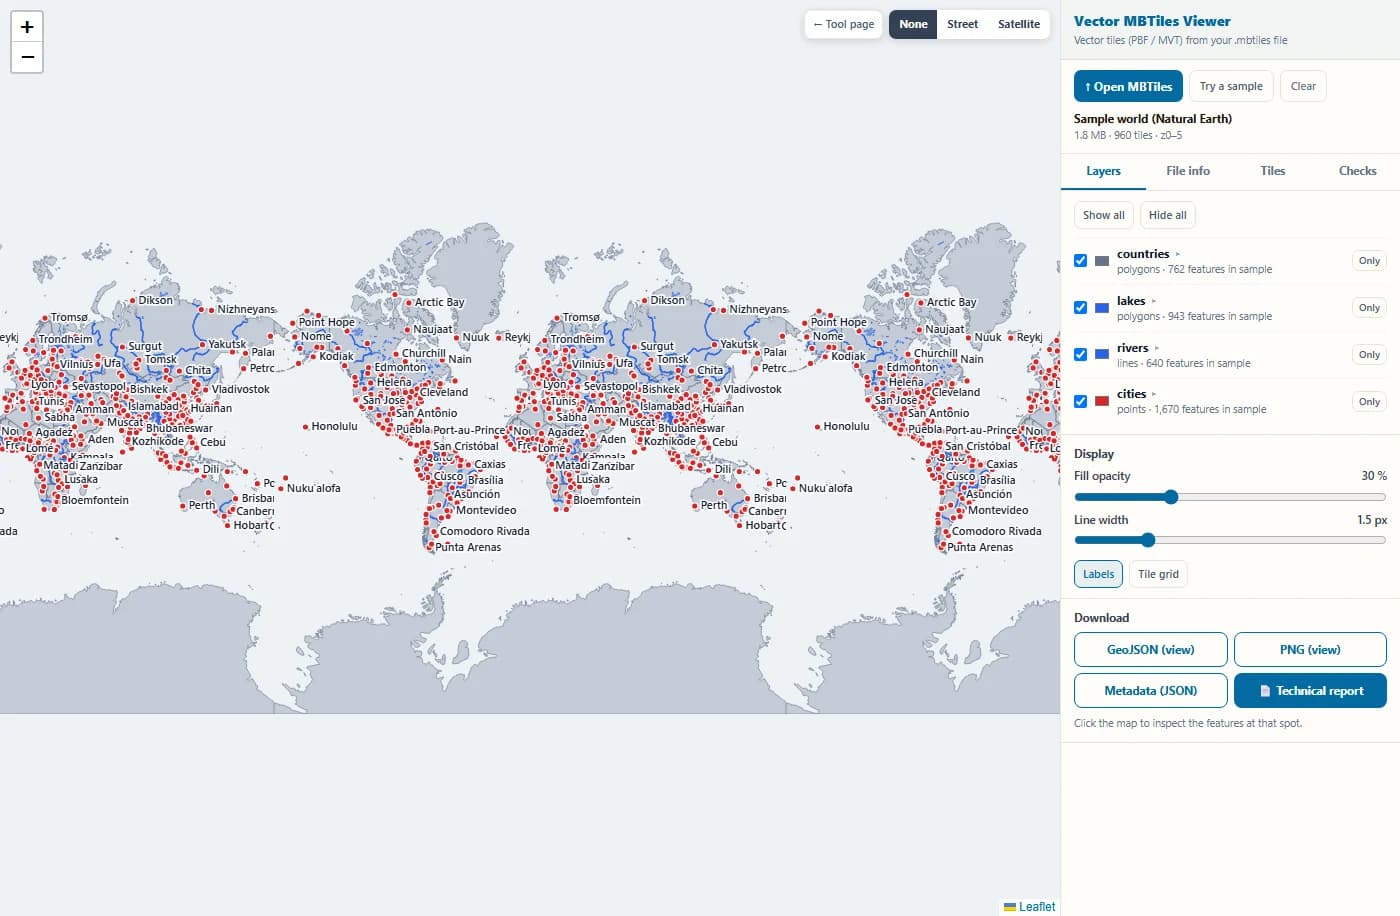
The viewer reads the SQLite database, zooms to the bounds and draws all four layers: countries as grey fills, lakes in blue, rivers as blue lines and cities as red dots with labels.
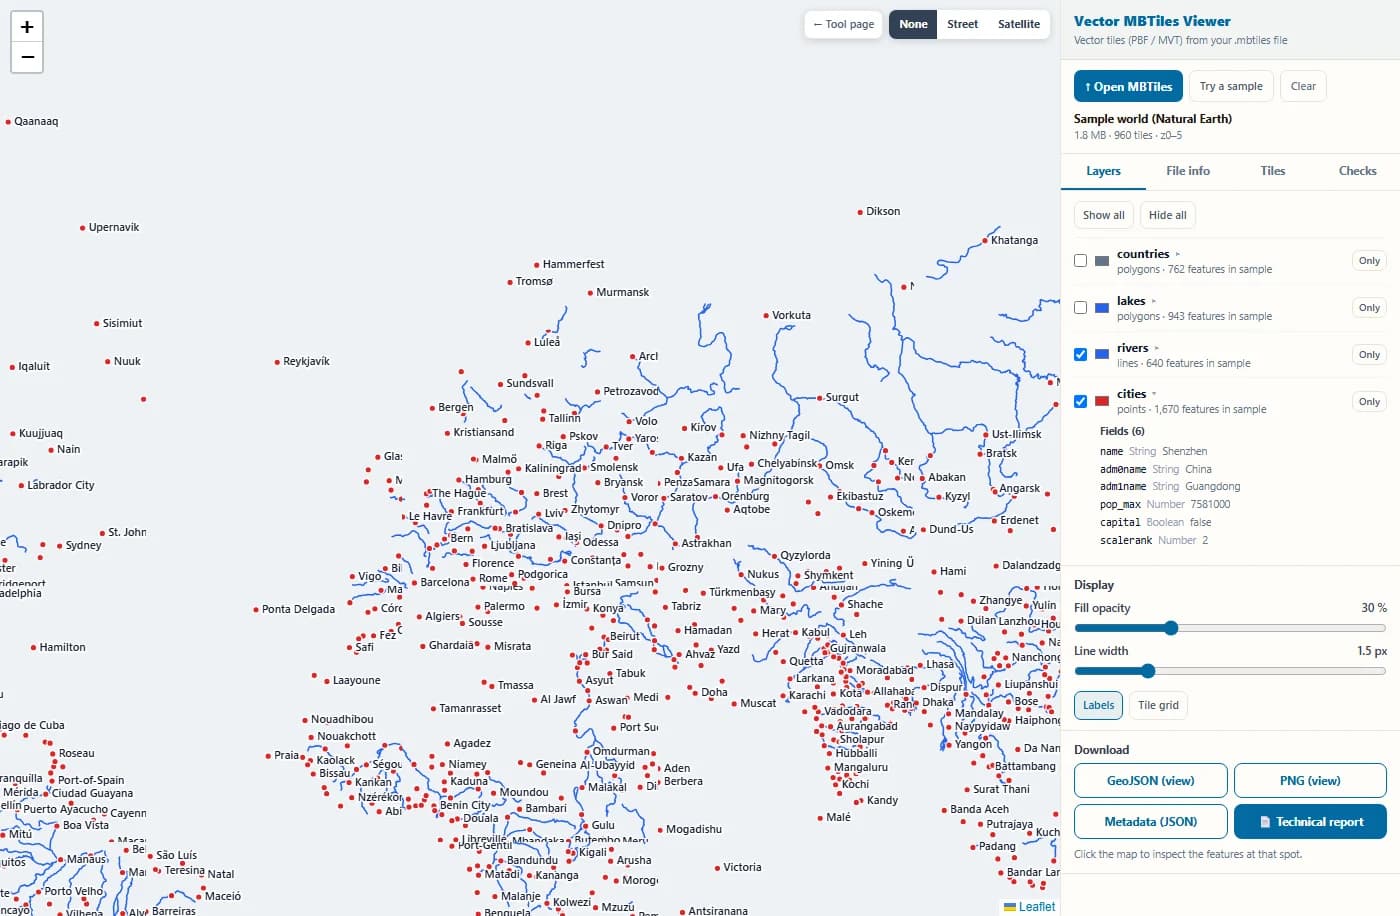
The Layers tab lists each layer with its geometry, the features found in a sample and every field with an example value. Here only rivers and cities are switched on, zoomed in over Europe.
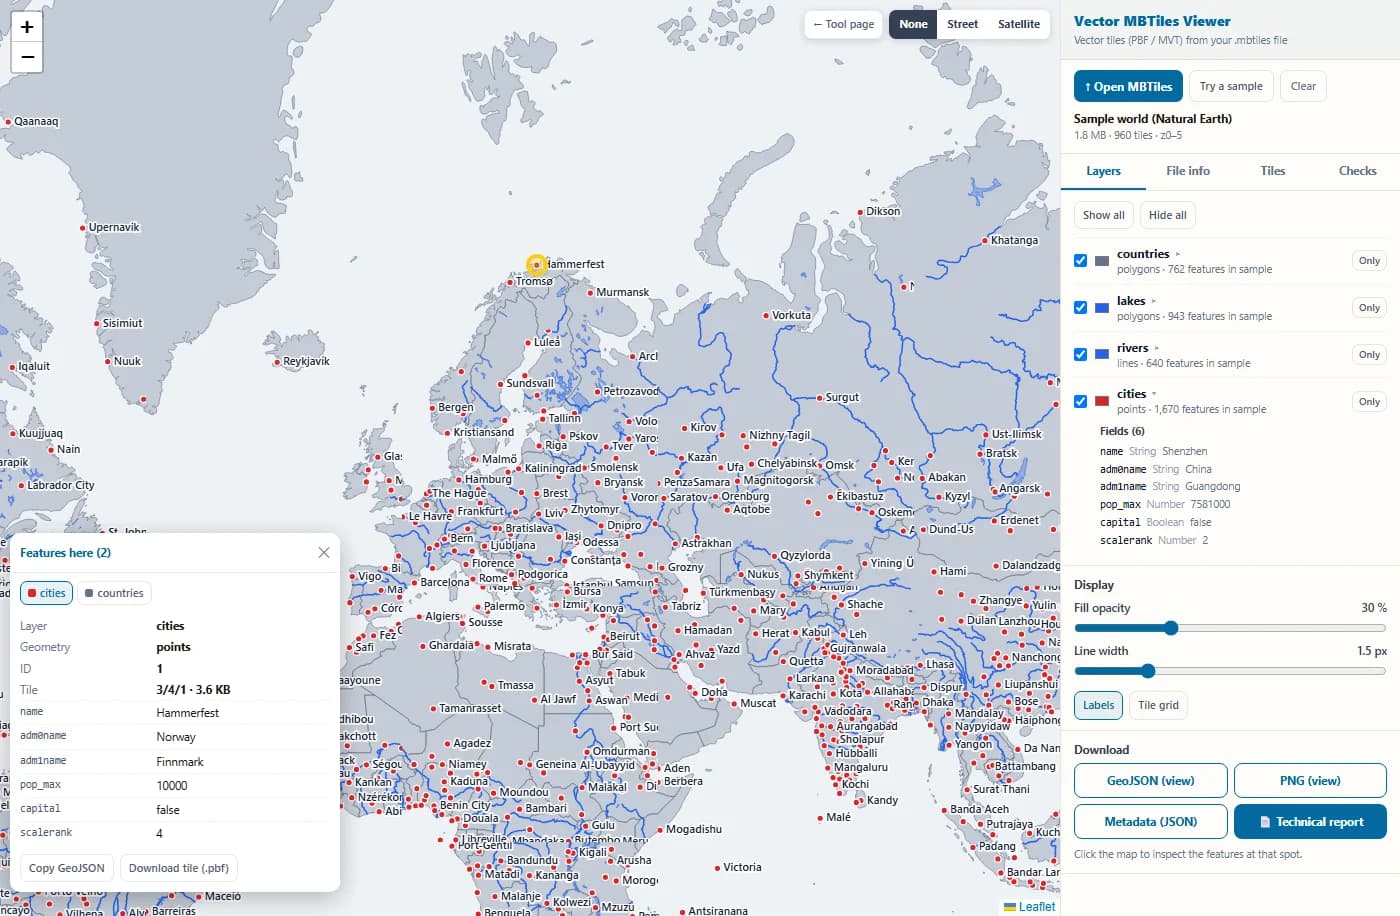
Click a city. The card shows its layer, geometry type, ID and all attributes, and the feature is highlighted. You can copy it as GeoJSON or download the tile it came from.
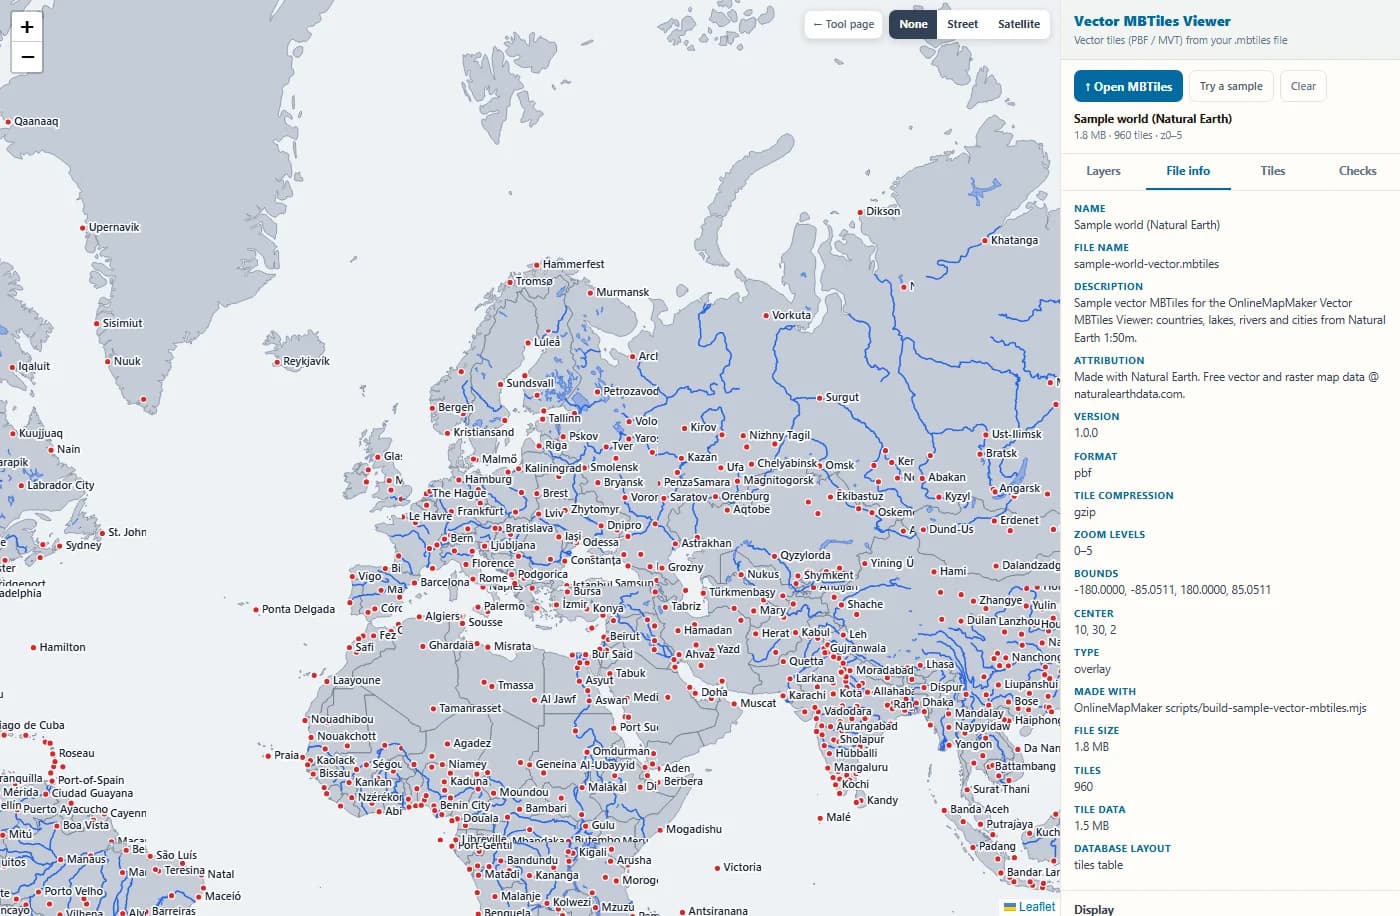
The File info tab turns the metadata table into plain words: name, attribution, format, gzip compression, zoom 0 to 5, bounds, center and the size of the file.
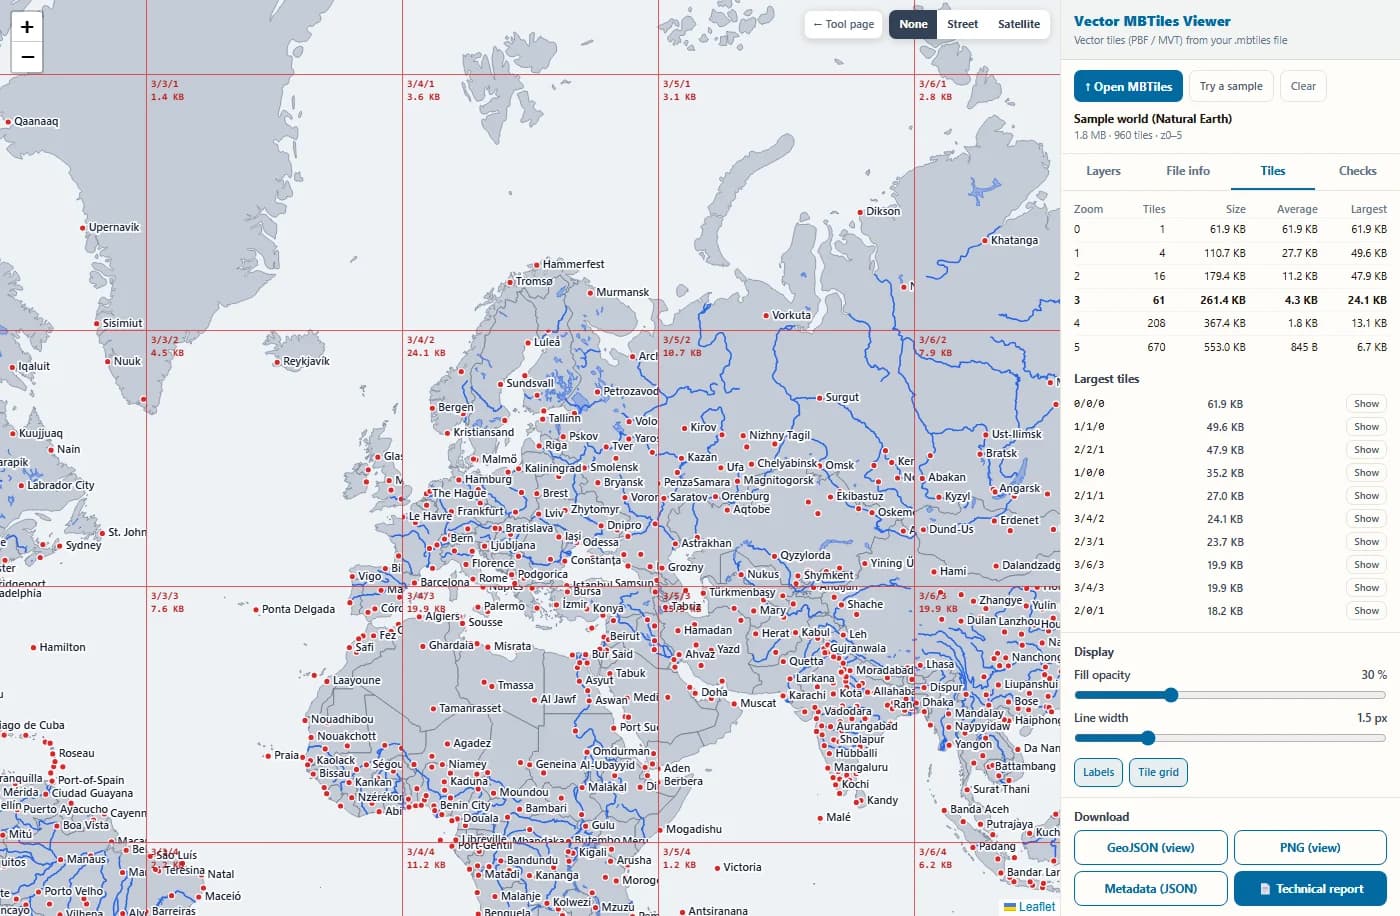
The Tiles tab shows tiles and sizes per zoom level and the largest tiles. With the tile grid switched on, every tile border is drawn with its z/x/y and stored size.
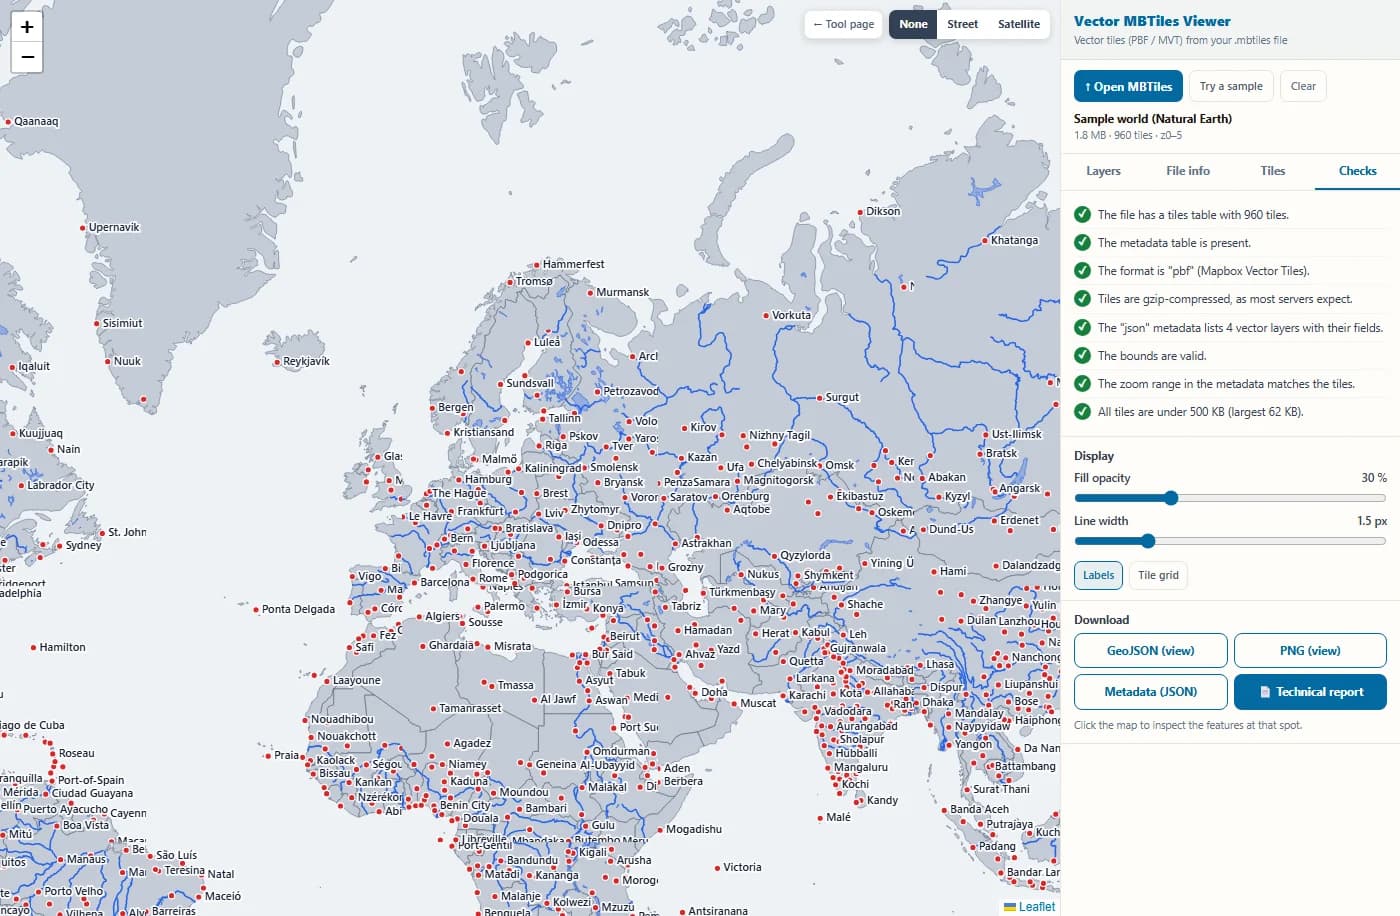
The Checks tab tests the file against the MBTiles and vector tile rules. The sample passes every check; a real-world file often shows a warning or two, each with an explanation.
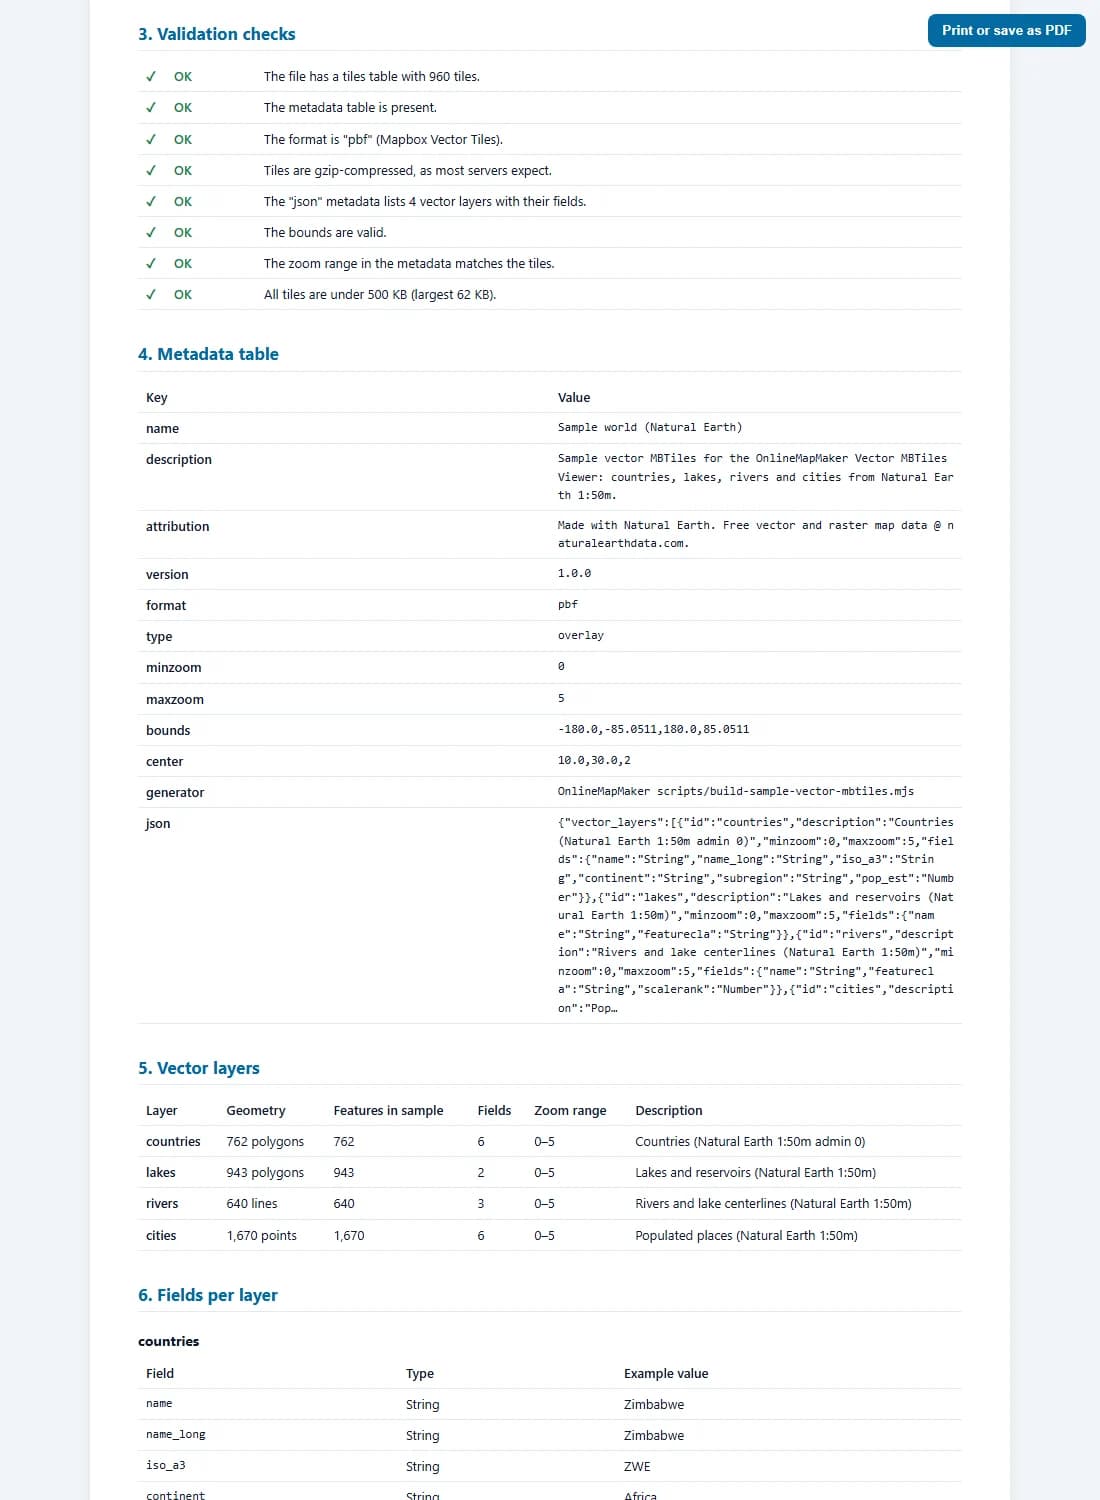
The technical report collects the summary, a map preview, the checks, the metadata, every layer and field, the tile statistics and recommendations in one page. Print it or save it as a PDF.
How to open an MBTiles file: your options
There are several ways to open an MBTiles file. The right one depends on whether you just want to look at it, check it, or use it in a project.
- In your browser, with this viewer. The fastest way to see what is inside a vector file: no install, no server, works on Windows, Mac, Linux and tablets. Best for checking a tileset, reading attributes and sharing a report. For raster MBTiles (PNG, JPEG, WebP tiles) use the MBTiles Viewer on this site.
- In QGIS. QGIS 3.14 and newer opens vector MBTiles directly: drag the file onto the map, or use Layer → Add Layer → Add Vector Tile Layer. Raster MBTiles open with Layer → Add Raster Layer. Good when you want to combine the tiles with other GIS data.
- With a tile server. TileServer GL, Martin and mbtileserver read an MBTiles file and serve its tiles over HTTP, so a web map in MapLibre GL JS, Mapbox GL JS or Leaflet can use it. This is how MBTiles maps are usually published.
- As PMTiles. Convert the file to PMTiles (there is a free converter on this site) and put that single file on any static hosting or object storage. MapLibre can read it directly, with no tile server.
- On a phone or GPS. Many offline map apps load MBTiles files for use without a connection. Check which tile format the app expects: some accept only raster tiles.
- As a database. Because MBTiles is SQLite, DB Browser for SQLite or the sqlite3 command line opens it too. You see the tables and binary blobs, not the map, but it is handy for fixing a metadata row.
One thing is the same everywhere: an MBTiles file carries data, not a style. Each app decides how to colour the layers. This viewer picks colours automatically so you can see the structure without writing a style first.
How the viewer reads and draws vector tiles
Opening a vector MBTiles file takes four steps: read the SQLite database, find the right tile, unpack and decode it, and draw it. Here is exactly what happens, with the formulas.
1. The MBTiles database
An MBTiles file is a SQLite database with two required tables. The viewer loads it into memory with sql.js, a version of SQLite compiled to WebAssembly, and runs normal SQL queries on it:
CREATE TABLE metadata (name text, value text);
CREATE TABLE tiles (zoom_level integer, tile_column integer,
                    tile_row integer, tile_data blob);

metadata rows:  name, format = pbf, minzoom, maxzoom, bounds,
                center, attribution, description, json, …
statistics:     SELECT zoom_level, COUNT(*), SUM(LENGTH(tile_data)),
                MAX(LENGTH(tile_data)) FROM tiles GROUP BY zoom_level
Some files store tiles as a view over two tables (map and images), so that identical tiles such as empty ocean are stored only once. The viewer handles both layouts and tells you which one your file uses.
2. From map position to tile row: the TMS flip
A web map numbers tiles from the top (row 0 is in the north). MBTiles follows the older TMS scheme and numbers rows from the bottom. So every tile request flips the row:
n = 2^z                                   tiles per side at zoom z
x = ⌊(λ + 180) / 360 × n⌋
y = ⌊(1 − ln(tan φ + sec φ) / π) / 2 × n⌋   web map row (from the north)

tile_row = n − 1 − y                        MBTiles row (from the south)

example  z = 5, x = 16, y = 10  →  tile_row = 32 − 1 − 10 = 21
A missing flip is the most common bug in home-made MBTiles readers: the map then shows the southern hemisphere where the northern one should be. If your own app draws the data upside down or in the wrong place, check this first.
3. Unpacking the tile
Vector tiles are almost always compressed. The viewer reads the first bytes of the tile to see how, and unpacks it with the browser's built-in DecompressionStream:
1F 8B …        gzip       (most files: tippecanoe, Planetiler, OpenMapTiles)
78 01/5E/9C/DA zlib       (some older tools)
anything else  not compressed

89 50 4E 47    PNG  ┐
FF D8          JPEG ├  raster tiles: this is not a vector file
52 49 46 46    WebP ┘
The same check finds raster MBTiles files even when their metadata is wrong, and sends you to the raster viewer instead of showing an empty map.
4. Decoding the protobuf
A Mapbox Vector Tile is a Protocol Buffers message. Numbers are stored as varints: 7 bits per byte, the 8th bit says "more bytes follow". Signed values use zigzag encoding, so small negative numbers stay short:
varint   300 = 1010 1100  0000 0010  → 0101100 + 0000010 × 128 = 300
zigzag   0 → 0,  −1 → 1,  1 → 2,  −2 → 3,  2 → 4
         decode: n = (z >>> 1) ^ −(z & 1)

Tile     { layers = 3 }
Layer    { name = 1, features = 2, keys = 3, values = 4, extent = 5, version = 15 }
Feature  { id = 1, tags = 2, type = 3, geometry = 4 }
tags     [key index, value index, key index, value index, …]
Attribute names and values are stored once per layer, in the keys and values lists. Each feature only stores pairs of index numbers, which is why vector tiles are so compact. The viewer's decoder is written from the specification and was tested against Mapbox's own reference decoder on more than 350,000 features with no difference.
5. Geometry commands
Geometry is a list of commands. Each command integer holds a command id and a count; the parameters that follow are zigzag-encoded and relative to the previous point. Coordinates are in tile units, 0 to 4096 across the tile by default (the "extent"):
command = (count << 3) | id     MoveTo = 1, LineTo = 2, ClosePath = 7

9  = (1 << 3) | 1   MoveTo, 1 point
     params 50, 34  →  +25, +17   cursor (25, 17)
18 = (2 << 3) | 2   LineTo, 2 points
     params 0, 18, 18, 0  →  (25, 26), (34, 26)
15 = (1 << 3) | 7   ClosePath

polygon rings: area > 0  exterior ring (clockwise on screen)
               area < 0  hole
area = ½ Σ (x_j·y_i − x_i·y_j)       surveyor's formula, y down
The sign of the ring area tells exterior rings from holes, so a lake inside a country stays a hole when it is drawn and when it is exported to GeoJSON.
6. Drawing, scaling and overzoom
Each map tile is a 256 × 256 pixel canvas (512 on high-resolution screens). The tile units are scaled to pixels, and past the deepest zoom level the parent tile is scaled up and shifted, which is called overzoom:
scale = 256 × f / extent          f = 2^(z_map − z_data)
offset = (x mod f, y mod f) × 256    part of the parent tile to show

example  data up to z 14, map at z 16
  f = 4, scale = 256 × 4 / 4096 = 0.25 px per unit
  map tile (x, y) uses data tile (⌊x/4⌋, ⌊y/4⌋)
Because the data is vector, the lines are drawn again at the new scale and stay sharp, unlike enlarged raster tiles. Line widths and dot sizes are divided by the scale so they keep the same size on screen at every zoom level.
7. Clicking a feature: hit testing
When you click, the viewer finds the data tile under the cursor, converts the click to tile units and tests the features of the visible layers from the top layer down:
units per pixel = extent / (256 × 2^(z_map − z_data))

point     hit if distance ≤ 7 px
line      hit if distance to a segment ≤ 5 px
          d² = |p − a − t(b − a)|²,  t = clamp(((p − a)·(b − a)) / |b − a|², 0, 1)
polygon   hit if a ray from the point crosses the rings an odd number of times
A quick bounding-box test skips most features before the exact test runs, so even tiles with tens of thousands of features answer at once.
8. Tile size budget
Large tiles make maps slow: each one must be downloaded, unpacked and decoded before anything is drawn. tippecanoe limits tiles to 500 KB by default, and the same 500 KB limit is widely used for vector tile services. The viewer measures every tile with one SQL query and flags the zoom levels that go over it:
stored size     = LENGTH(tile_data)          bytes, still compressed
average size    = SUM(size) / COUNT(*)       per zoom level
coverage        = tiles / 4^z                share of the world grid

guideline       largest tile < 500 KB  (512,000 bytes)
In practice the largest tiles are usually at a middle zoom level in dense cities, where many buildings and roads meet before simplification starts to drop them. The Largest tiles list takes you straight there.
MBTiles and the export formats in detail
What is inside an MBTiles file, how vector and raster MBTiles differ, and what each download from this viewer contains.
Vector MBTiles .mbtiles
A SQLite database following the MBTiles 1.3 specification, with format = pbf. Each tile is a gzip-compressed Mapbox Vector Tile with one or more named layers. The json metadata row lists the layers and their fields, and tippecanoe also adds tilestats with feature counts and attribute values.
metadata.json = {
  "vector_layers": [
    { "id": "cities", "minzoom": 0, "maxzoom": 5,
      "fields": { "name": "String", "pop_max": "Number" } } ],
  "tilestats": { "layerCount": 1, "layers": [ … ] }
}
Vector MBTiles files are small for the area they cover, can be styled freely, and stay sharp at any zoom. They need a renderer (MapLibre, Mapbox GL, QGIS or this viewer) and a style to look like a finished map.
Raster MBTiles .mbtiles
The same database layout, but each tile is a finished image (PNG, JPEG or WebP), usually 256 × 256 pixels. The style is baked into the pixels, so the map looks the same everywhere, but it cannot be restyled or queried, and it gets blurry past its last zoom level.
This viewer recognises raster files by their image signature and sends you to the raster MBTiles Viewer on this site, which is built for them.
GeoJSON (view) .geojson
All features of the visible layers in the tiles that cover the current view, at the current data zoom level, as an RFC 7946 FeatureCollection in WGS84. Each feature keeps its attributes and gets two extra ones: _layer and _tile. Polygons are grouped into Polygon or MultiPolygon with their holes.
{ "type": "Feature", "id": 812,
  "properties": { "name": "Lyon", "pop_max": 1423000,
                  "_layer": "cities", "_tile": "5/16/11" },
  "geometry": { "type": "Point", "coordinates": [4.8320114, 45.7578137] } }
Features are clipped at tile edges, the way they are stored, so a long road can come out as several pieces. One export covers at most 64 tiles; zoom in to export a smaller area in more detail. Use it to check data in QGIS or to pull a small extract.
PNG (view) .png
A picture of the vector layers as you see them in the map window, with a white background, a title bar with the file name and zoom level, and the attribution from the metadata.
Handy for documentation, a bug report or a quick preview for a client. The base map is not included, so there are no third-party image rights to worry about.
Metadata (JSON) .json
Every row of the metadata table, with the json row parsed into real JSON, plus the tile statistics per zoom level and the layer list found in the tiles.
Useful to compare two versions of a tileset, or to copy the vector_layers list into a MapLibre style.
Tile (.pbf) .pbf
The single vector tile under your click, unpacked, exactly as a tile server would send it after decompression. The file name holds its z/x/y.
Feed it to other tools (for example vt2geojson or a protobuf viewer) to debug one tile in detail.
Technical report .html
One HTML page with the file summary, a map preview, every validation check, the full metadata table, the layers with geometry types and fields, the tiles per zoom level, the largest tiles, recommendations and how to use the file.
It prints cleanly to PDF. Attach it to a ticket or send it with a delivery, so the receiver sees what is in the tileset without opening it.
All exports are made in your browser from the file you opened. Nothing is sent to a server.
Who uses a vector MBTiles viewer
Vector tiles sit between data and map, so many different people need to look inside them.
- Web map developers. Check a tileset before you write a MapLibre or Mapbox GL style: which layers exist, what the fields are called, at which zoom levels data appears. The field list and example values save a lot of guessing.
- GIS analysts. Confirm that a tippecanoe, Planetiler or QGIS export contains what you expect, with the right attributes and zoom range, before handing it over.
- DevOps and tile server admins. Find oversized tiles, missing metadata and wrong zoom ranges before deploying to TileServer GL, Martin or a CDN, and keep the report as a record.
- Offline and field mapping. Check that the MBTiles maps you load onto tablets or rugged devices cover the right area and zoom levels before you go out of range.
- Data buyers and reviewers. Look at a vector tileset from a supplier without installing anything, click through the attributes and send back the report.
- Students and teachers. See how vector tiles really work: switch on the tile grid, compare tile sizes across zoom levels and watch overzoom keep lines sharp.
- Open data publishers. Verify the attribution, bounds and description in the metadata before you publish a tileset, so users get a correct credit and a correct start view.
- Support and bug reports. When a map shows a gap or a broken feature, find the tile, download it as .pbf and attach it with the report to the bug ticket.
Frequently asked questions about MBTiles and vector tiles
The 20 questions people ask most about MBTiles files and this viewer.
1. What is an MBTiles file?
An MBTiles file is a SQLite database that stores map tiles. It has a tiles table with one row per tile (zoom, column, row and the tile data) and a metadata table with the name, format, zoom range, bounds and other details. One file can hold a whole tiled map, which makes it easy to copy, share and use offline.
2. What is the difference between vector and raster MBTiles?
Raster MBTiles store finished images (PNG, JPEG or WebP). Vector MBTiles store Mapbox Vector Tiles: geometry and attributes that a map app styles and draws itself. Vector files are smaller for the same area, stay sharp at every zoom and can be restyled or queried. Check the format row: pbf means vector.
3. How do I open an MBTiles file?
For a quick look at a vector file, drop it into this viewer: no install and no upload. In QGIS 3.14 or newer, drag the file onto the map or use Layer → Add Layer → Add Vector Tile Layer. To publish it on a website, serve it with TileServer GL, Martin or mbtileserver, or convert it to PMTiles. The section "How to open an MBTiles file" above compares all the options.
4. Is this vector MBTiles viewer free?
Yes. It is free, with no account, no file limit per day and no watermark on the exports. Everything runs in your browser, so there is no server cost.
5. Is my file uploaded anywhere?
No. The file is read with FileReader and opened with sql.js (SQLite in WebAssembly) inside your browser tab. The tiles are decoded and drawn there too. Only if you switch on a base map does the browser load street or satellite tiles from those providers; your file stays local.
6. How big can the file be?
Up to 300 MB. The whole database is loaded into the browser's memory, so very large files need a lot of RAM. On phones and tablets, files under 100 MB work best. For planet-scale tilesets use a tile server or QGIS.
7. Why is the map empty when the file opens?
Usually the map is below the file's first zoom level: a city tileset may start at zoom 10, and the viewer then shows a note to zoom in. Other causes are wrong bounds in the metadata (the map zooms to the wrong place) or raster tiles in the file. The Checks tab tells you which one it is.
8. What does overzoom mean?
A tileset has a last zoom level, often 14. When you zoom in further, the viewer keeps using the zoom 14 tiles and draws them larger. Because vector data is redrawn, the lines stay sharp. Many basemaps stop at zoom 14 for this reason: the tiles still hold enough detail for street level.
9. Why are features cut at tile edges?
Each vector tile only holds the parts of features that fall inside it, plus a small buffer. A long river or a large country is stored as many pieces, one per tile. Map renderers draw the pieces next to each other so the cut is invisible. In the GeoJSON export the pieces stay separate, each with a _tile attribute.
10. Why are some layers missing from the metadata?
The json metadata row is written by the tool that made the file. If the file was edited, merged from several sources or made by a script, a layer can exist in the tiles without being listed. The viewer decodes a sample of tiles, finds those layers anyway and marks them "not in metadata".
11. What is the TMS scheme in MBTiles?
MBTiles numbers tile rows from the bottom (south), like the older TMS standard, while web maps number them from the top (north). Any program reading MBTiles must flip the row: tile_row = 2^z − 1 − y. If a map from an MBTiles file appears upside down or in the wrong hemisphere, a missing flip is the likely cause.
12. How large should vector tiles be?
Keep every tile under 500 KB, which is tippecanoe's default limit and a common limit of tile services. Most good tiles are between 10 and 200 KB. The Tiles tab shows the largest tiles per zoom level, and the report suggests ways to shrink them.
13. Can I edit an MBTiles file with this viewer?
No, it only reads. To change the data, edit the source (GeoJSON, Shapefile, a database) and build the tiles again with tippecanoe, Planetiler or QGIS. To fix a metadata row, open the file in DB Browser for SQLite and edit the metadata table.
14. Can I convert MBTiles to GeoJSON?
For a part of the map, yes: zoom to the area and press "GeoJSON (view)". It exports the visible layers from the tiles in view, up to 64 tiles at once. For a whole tileset, the cleaner way is to export from the original source data, because tiles are simplified and cut at the edges.
15. Can I convert MBTiles to PMTiles?
Yes, with the free MBTiles to PMTiles converter on this site. PMTiles is one file that MapLibre can read from any static hosting, without a tile server. The tiles inside stay exactly the same.
16. Does an MBTiles file contain a map style?
No. A vector MBTiles file holds data only; the colours, line widths and labels come from a style, usually a MapLibre or Mapbox style JSON. This viewer picks colours automatically from the layer names so you can see the structure at once.
17. Which tools make vector MBTiles?
The most common are tippecanoe (from GeoJSON and CSV), Planetiler and OpenMapTiles (from OpenStreetMap), QGIS (Generate XYZ tiles / vector tile export) and GDAL's MVT driver. The File info tab shows the generator when the file records it.
18. What is tilestats?
tilestats is a part of the json metadata written by tippecanoe. It counts the features in each layer and lists attribute names, types and up to 100 example values. When it is present, the viewer shows the total feature count of each layer.
19. Can I view raster MBTiles here?
This page is built for vector tiles. If you open a raster file, the viewer recognises the image tiles and links you to the MBTiles Viewer on this site, which displays PNG, JPEG and WebP tiles.
20. Does it work on a phone or tablet?
Yes, in any current browser on iOS, Android, Windows, macOS and Linux. Keep phone files small (under 100 MB), use the fullscreen version for more room, and tap a feature to inspect it.
Specifications, software and data credits
The viewer is built on open specifications and open software:
- MBTiles Specification (Mapbox) · SpecificationMBTiles specification by Mapbox: the SQLite layout of the file, the TMS row order and the metadata rows checked by the viewer.
- Mapbox Vector Tile Specification · SpecificationMapbox Vector Tile specification: the protobuf layout, geometry commands and winding rules that the decoder follows.
- sql.js · MITSQLite compiled to WebAssembly, used to open the .mbtiles database in your browser.
- Leaflet 1.9 · BSD-2-ClauseInteractive map and the canvas grid layer that draws the tiles.
- Natural Earth · Public domainPublic domain data used to build the sample tileset (countries, lakes, rivers and cities at 1:50m).
- Protomaps (hosted by KONAKTIVE), CARTO, OpenStreetMap, Esri World Imagery · ODbL and provider termsOptional base maps: own vector tiles hosted by KONAKTIVE with CARTO and OpenStreetMap as fallback, and Esri World Imagery.
The vector tile decoder, the renderer, the checks and all exports were written for this site and run entirely in your browser.
Related tile and GIS file tools
The checks follow the MBTiles 1.3 and Mapbox Vector Tile 2.1 specifications and common practice; a passed check does not guarantee that every map app will accept the file. Sample data: Natural Earth. Optional base maps © OpenStreetMap contributors, drawn with Protomaps (hosted by KONAKTIVE), with CARTO as the fallback. Satellite imagery: Esri.