

What this tool does
Excel is where most location lists live: customer sites, store networks, sample points, events, assets in the field. Each row has a latitude and a longitude, but a spreadsheet cannot show you where the rows are. You see numbers like 52.52 and 13.405 and have to imagine the map.
This tool reads the workbook directly, without saving it as CSV first. It looks through every sheet, skips title rows above the table, and finds the latitude and longitude columns from their names, such as Lat/Long, Latitude/Longitude or Breitengrad/Längengrad. It reads decimal degrees, numbers with a comma, and degrees-minutes-seconds. Every row with valid coordinates becomes a point on an interactive map: hover to see its name, click to read the whole row, and use the legend to hide or show groups of points.
Then you can colorize the points by any column. A text column such as a store type gets one color per value. A number column such as sales gets five graduated classes, from low to high. The colors also go into the downloads: the KML file opens in Google Earth with the same colors, and the GeoJSON file carries them as marker-color. The workbook is read in your browser and never uploaded.
How to prepare your spreadsheet
Most sheets work as they are. Here is the top of the sample workbook: a title in row 1, an empty row, the column names in row 3 and one store per row below. The viewer finds row 3 as the header by itself. The web shop in the last row has no coordinates, so it is counted but not drawn.
| A | B | E | G | H | I | |
| 1 | Sample data: fictional store network | |||||
| 2 | ||||||
| 3 | Store ID | Store | Type | Sales 2025 (EUR) | Lat | Long |
| 4 | S-001 | Berlin Flagship | Flagship | 2,100,000 | 52.52 | 13.405 |
| 5 | S-002 | Hamburg Central | Standard | 1,383,000 | 53.5511 | 9.9937 |
| … | ||||||
| 35 | S-032 | Web Shop | Online | 4,200,000 |
- One row per place
- Each row is one point. Keep summary rows, such as totals, out of the table or below it in a separate area.
- A header row
- Give each column a name in one row. Title rows and empty rows above it are skipped automatically. If the guess is wrong, choose the header row in the Workbook panel.
- Latitude and longitude columns
- Two columns with decimal degrees in WGS84, the system GPS and web maps use. Latitude first is a common convention, but the column order does not matter here.
- Several sheets
- The tool opens the first sheet with coordinates. All other sheets are listed in the Sheet menu.
- No coordinates yet?
- If you only have addresses, get coordinates first with the address-to-coordinates tool on this site, then add them as two columns.
Excel can show a number with fewer decimals than it stores, for example 48.86 for a stored 48.858412. This tool reads the stored value, so no precision is lost. Saving the sheet as CSV in Excel uses the displayed value instead, which is one reason to load the .xlsx file directly.
Which column names are recognised
Column names are compared after a cleanup: upper and lower case are ignored, text in brackets such as (WGS84) is removed, and spaces and dots become underscores. If nothing matches, choose the columns in the Coordinates panel.
- Latitude
lat,latitude,lati,y,ycoord,point_y,decimalLatitude,gps_lat,lat_dd, plusBreite/Breitengrad,latitud,latitudineand緯度.- Longitude
lng,lon,long,longitude,x,xcoord,point_x,decimalLongitude,gps_lon,lon_dd, plusLänge/Längengrad,longitud,longitudineand経度.- One column with both
- Names such as
coordinates,latlng,position,location,gps,wktorgeometry, when the cells hold two numbers ("52.52, 13.40") or a WKT point (POINT (13.40 52.52)). - Choosing between candidates
- Every possible latitude/longitude pair is tested on the first 300 rows, and the pair with the most valid values wins.
x/ylose ties against real lat/lon names, so projected x/y columns in metres are never taken as degrees. - Label column
- A column called
name,title,label,store,siteorstationbecomes the point name. Otherwise the first column that is mostly text is used. The name appears on hover, as the popup title and as the KML placemark name.
Colorizing points by a column
Pick any column under "Color by column" and the points take a color from its values. The tool chooses the method from the data, and you can switch it when the column holds numbers.
- Each value (categories)
- For text columns and number columns with few values. Every value gets its own color, the most common value first. Up to 11 values get a color; all others share a grey "Other" class.
- Graduated (5 classes)
- For number columns with many values, such as sales or population. The values are split into five quantile classes from dark purple (low) to green (high), each with about the same number of points.
- Empty and text values
- In a graduated column, rows without a number go into a grey "No number" class, so they stay visible.
- Interactive legend
- The legend appears on the map and in the sidebar. Click a value or class to hide its points, click again to show them. The counts tell you how many points are in each group.
- Colors in the downloads
- KML gets one style per color, so Google Earth shows the same colors. GeoJSON gets a
marker-colorproperty on every point, which geojson.io and many web maps read. Hidden points are left out of both files.
My take: use categories to answer "what kind is it?" and graduated classes to answer "how much?". If a number column has only a handful of values, such as a rating from 1 to 5, "Each value" is usually clearer than classes.
Technical details
This is exactly what the tool accepts and produces.
- Input
.xlsx,.xlsm,.xlsband older.xlsworkbooks, plus OpenDocument.odsspreadsheets, up to 50 MB. For.csvand.tsvfiles, use the CSV to Map tool or the TSV Viewer.- Cell values
- Numbers are read at full stored precision, not as formatted. Dates appear as Excel shows them. For formulas, the last calculated result saved in the file is used.
- Coordinate formats
- Decimal degrees (
48.8584,48,8584), with a hemisphere letter (48.8584 N), and degrees-minutes-seconds (48°51'30"N,48 51 30 N). - Valid coordinates
- Latitude between −90 and 90, longitude between −180 and 180 (WGS84). Rows outside these ranges are counted and left off the map. Rows that would fit with the two values swapped are counted too, with a Swap button.
- Interactive map
- Points are drawn on a canvas, so tens of thousands stay smooth. Hover shows the label, a click opens the full row, and the legend hides or shows groups. Street and satellite basemaps.
- Table view
- The Table button shows the sheet with sorting, a filter and 100 rows per page. The ⌖ button on a row jumps to its point on the map.
- GeoJSON export
- A FeatureCollection of points with every column as a property, numbers as numbers, and
marker-colorwhen the points are colorized. - KML export
- KML 2.2 with one placemark per point, the label column as its name, every column in ExtendedData, and one icon style per color.
- Privacy
- The workbook is read in your browser. Only the basemap tiles come from the internet.
How to map an Excel sheet, step by step
Here is the whole workflow with the built-in sample: a fictional network of 32 stores in Europe with Lat and Long columns, a store type, an opening date and 2025 sales. The table starts in row 3, below a title, and the web shop has no coordinates.
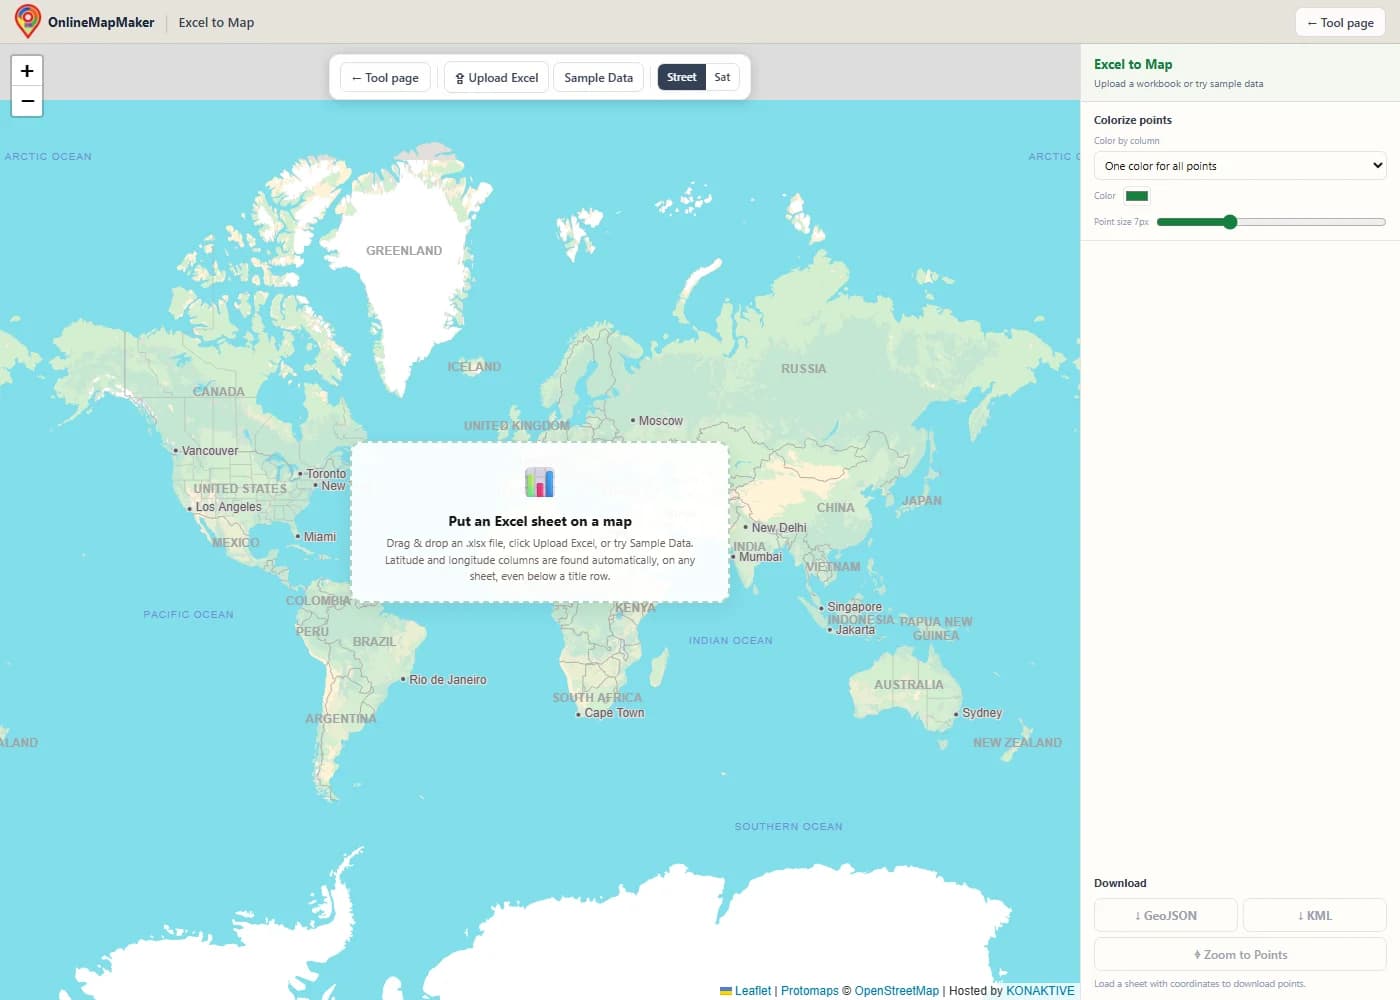
The map opens with a street basemap. Click Upload Excel or drag a workbook onto the map. Here I clicked Sample Data.
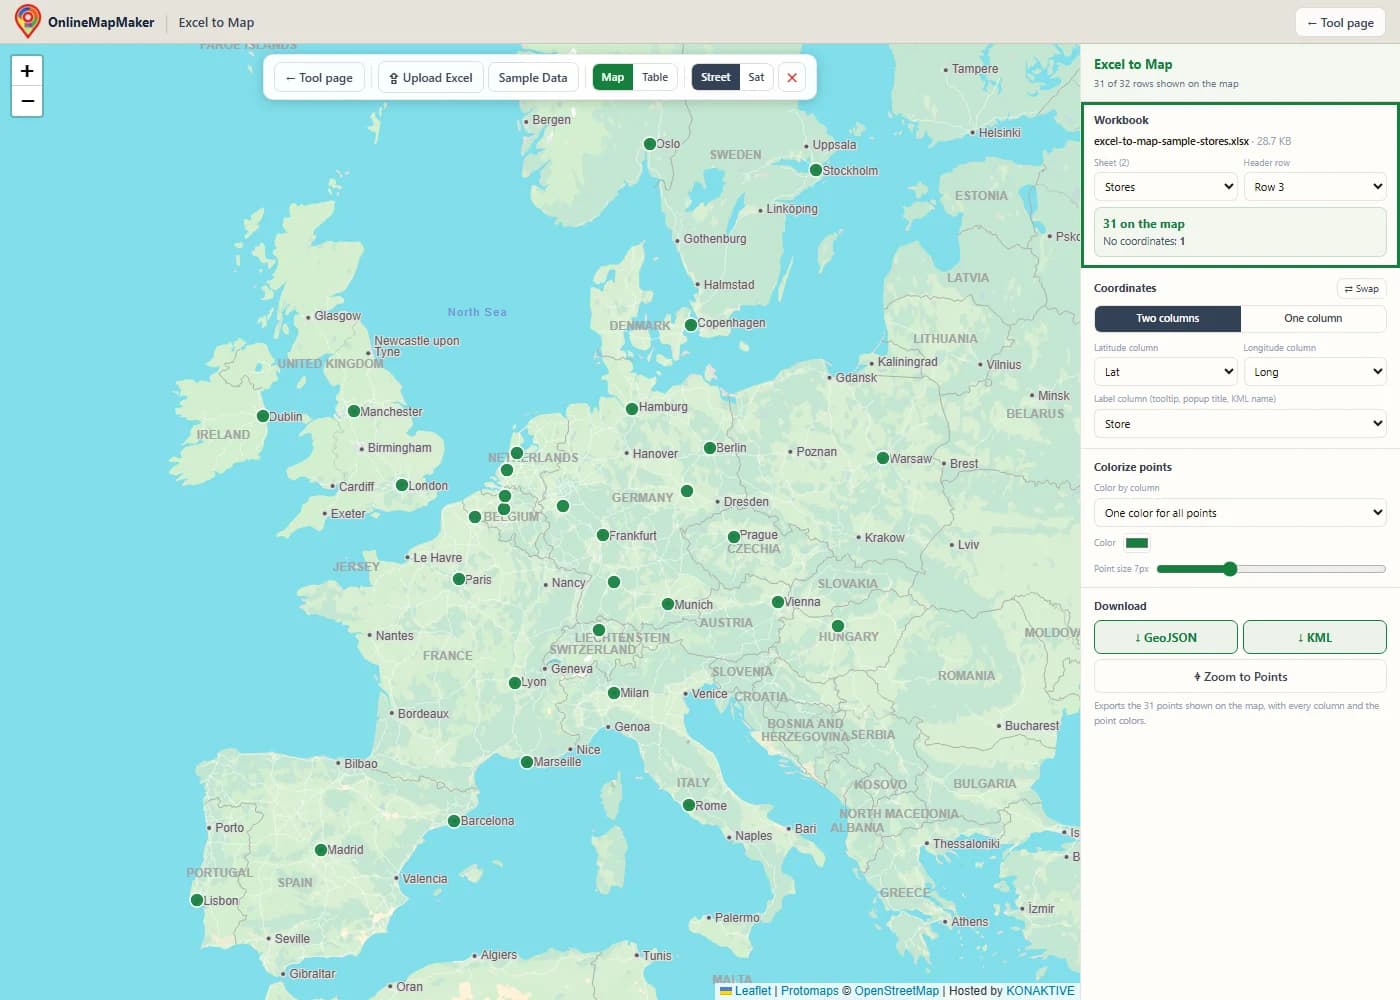
The Workbook panel shows the sheet that was opened ("Stores", the first of 2 sheets) and the header row it found: row 3, below the title. 31 of the 32 stores are on the map; the web shop has no coordinates.
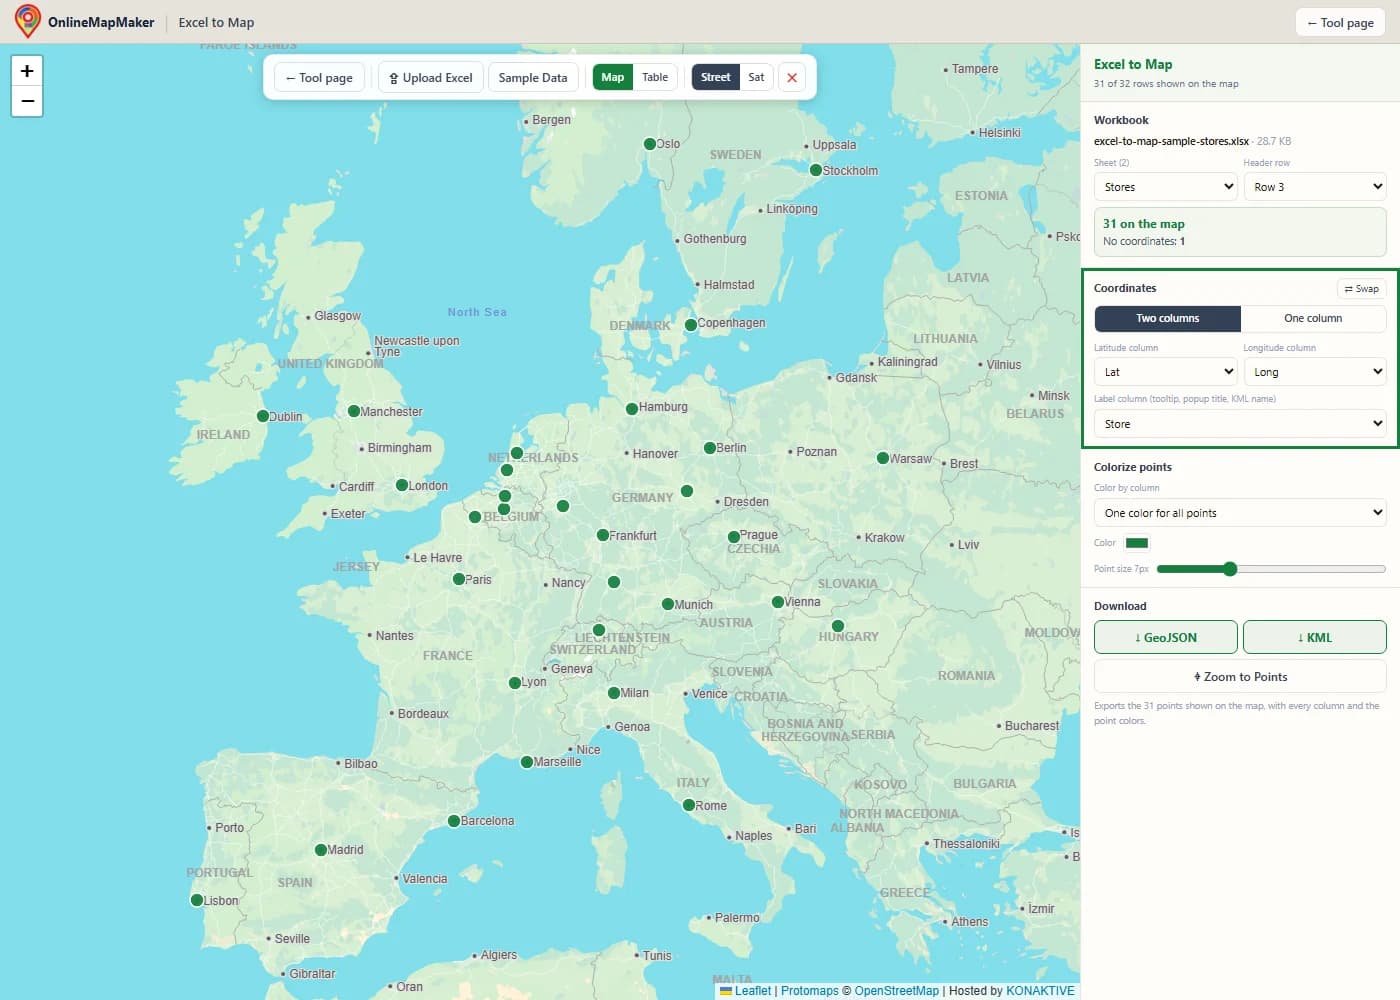
The Coordinates panel shows the detected columns, Lat and Long, and the label column, Store. The label appears when you hover over a point and as the title of its popup.
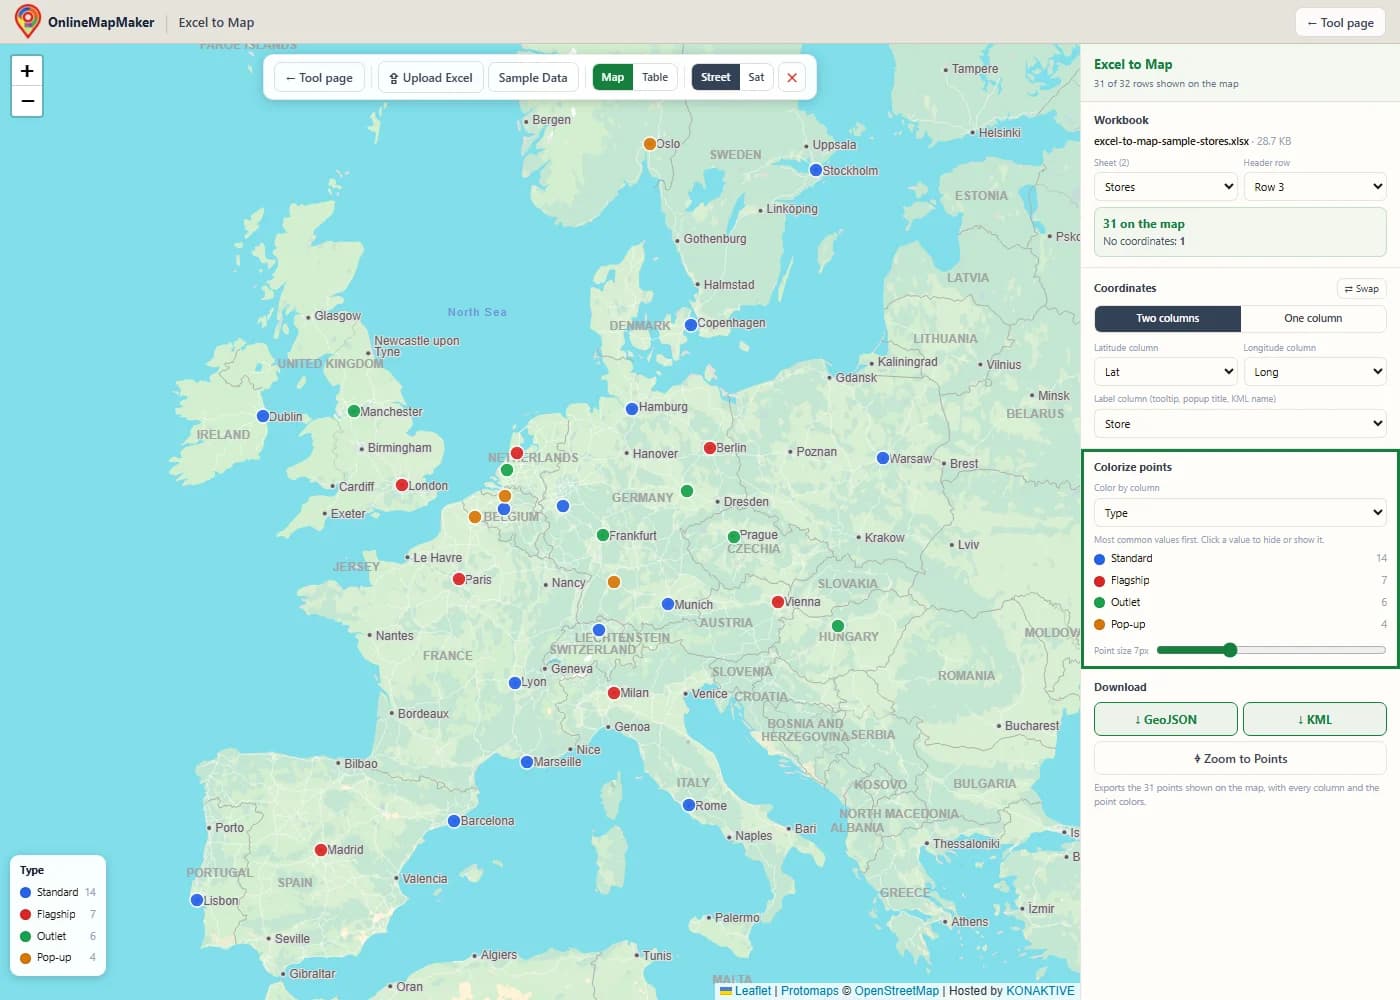
Choose Type under "Color by column". Each store type gets its own color, and a legend with counts appears on the map and in the sidebar.
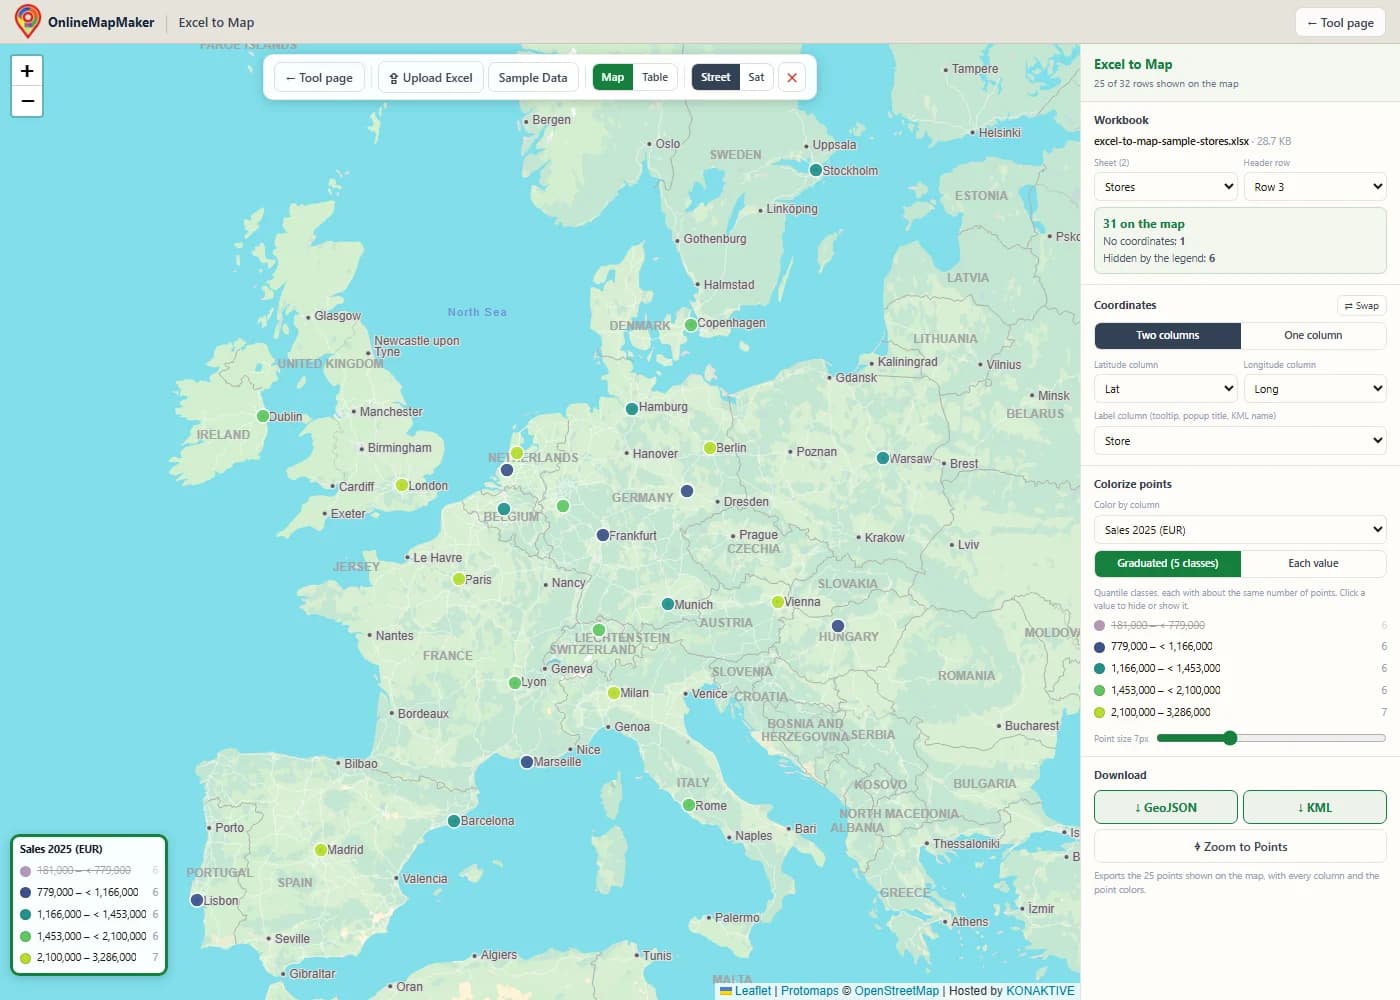
Choose Sales 2025 (EUR) and the tool switches to five graduated classes, from low (purple) to high (green). Here I clicked the lowest class in the legend to hide those stores.
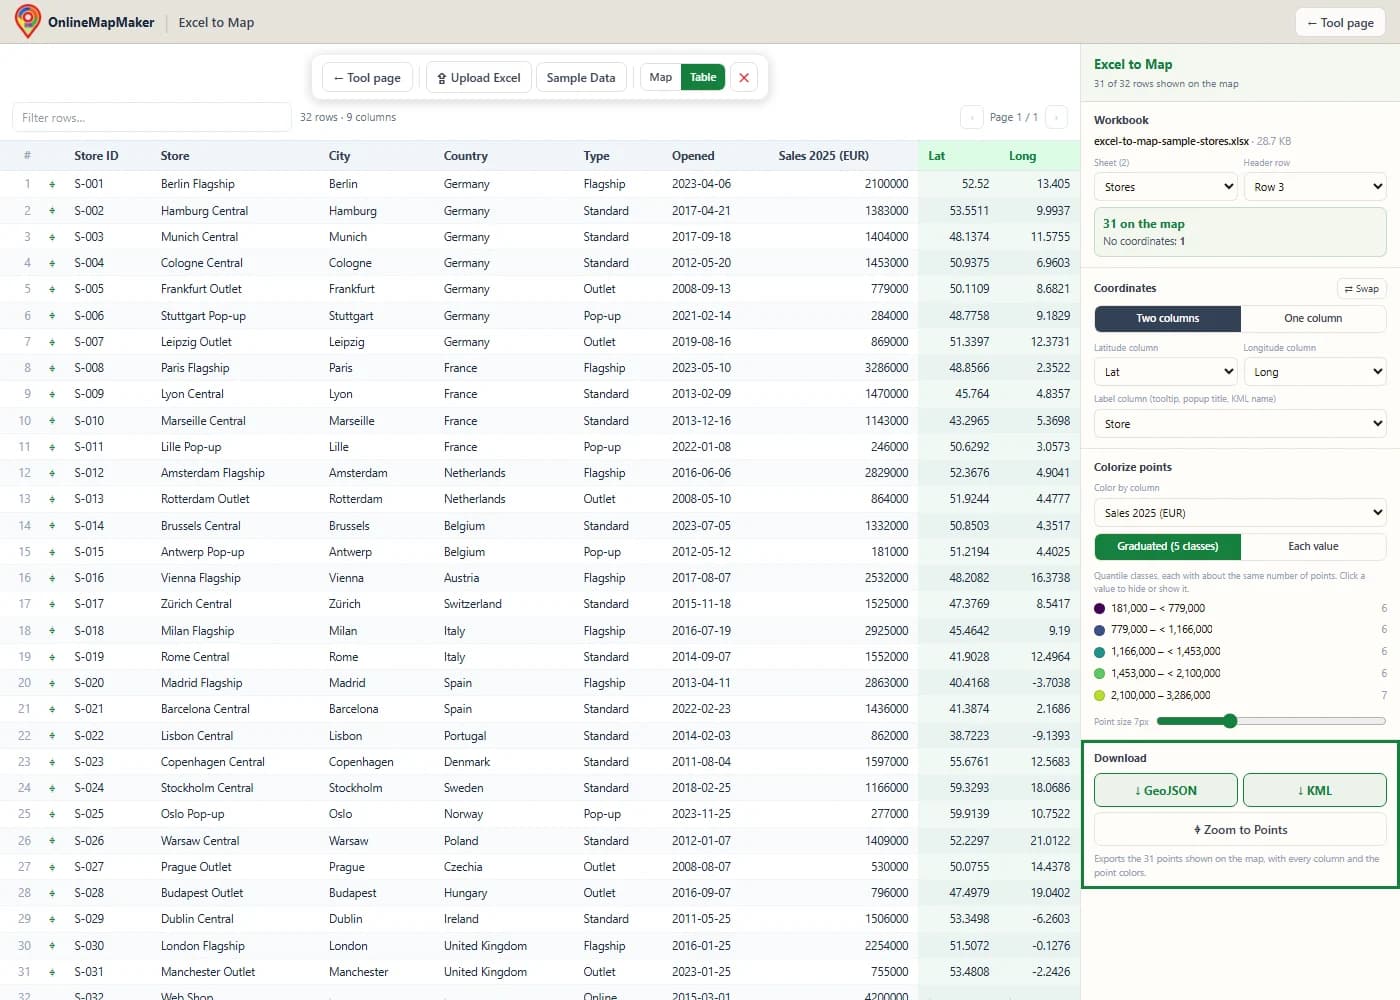
Download the points that are shown on the map. KML opens in Google Earth and Google My Maps with the same colors; GeoJSON works in QGIS, ArcGIS and web maps. The Table button shows the sheet itself.
Other ways to map Excel data
This tool is the quickest way to see a sheet on a map and get a KML or GeoJSON file. These are the other routes I use, and when each one makes sense.
Google My Maps
My Maps can import an .xlsx file and place the rows from latitude and longitude columns or from addresses. It is good for sharing a map with a link, but each import is limited to 2,000 rows, and styling by a column is basic.
Excel 3D Maps
Excel for Windows has 3D Maps (Insert > 3D Map), which plots rows on a globe inside Excel. It is fine for a presentation, but it cannot export KML or GeoJSON, and it is not available on every Excel version.
QGIS
QGIS opens .xlsx files as tables (Layer > Add Layer > Add Vector Layer). The Processing tool "Create points layer from table" turns the table into points, and you can then style them and save them as KML or GeoJSON. It is the right choice for real GIS work.
Python with pandas and GeoPandas
pandas.read_excel reads a sheet, and its header argument skips title rows. GeoPandas turns the coordinates into points and writes GeoJSON or KML. This is the way to go when the same sheet arrives every week.
The same job in code
Both examples read the sample workbook used above, where the column names are in row 3 and the coordinates are in Lat and Long.
# Python: pandas reads the sheet, GeoPandas writes GeoJSON and KML
import pandas as pd
import geopandas as gpd

# header=2: the column names are in row 3, below a title row and an empty row
df = pd.read_excel("stores.xlsx", sheet_name="Stores", header=2)
df = df.dropna(subset=["Lat", "Long"])

gdf = gpd.GeoDataFrame(
    df, geometry=gpd.points_from_xy(df["Long"], df["Lat"]), crs="EPSG:4326"
)
gdf.to_file("stores.geojson", driver="GeoJSON")
gdf.to_file("stores.kml", driver="KML")
// JavaScript: SheetJS reads the workbook, Leaflet draws the points
import * as XLSX from "xlsx";
const wb = XLSX.read(await file.arrayBuffer());
const rows = XLSX.utils.sheet_to_json(wb.Sheets["Stores"], { range: 2 });
for (const r of rows) {
if (r.Lat == null || r.Long == null) continue;
L.circleMarker([r.Lat, r.Long]).bindPopup(r.Store).addTo(map); // Leaflet: [lat, lng]
}My take: use this tool to look at a sheet and send someone a KML file in a minute. Use QGIS or Python when the map is part of a larger analysis or a repeated job.
How the tool works
This is what happens between dropping a workbook and seeing colored points. Every step runs in your browser.
- Read the workbook. SheetJS reads the file. For every sheet, the used range is read cell by cell: numbers at full precision, dates and errors as Excel shows them, and text as it is. Empty rows and empty columns are dropped.
- Find the header row. The header is the first of the first 10 rows that fills at least half the width of the table and is mostly text. Shorter rows above it, such as a title, are skipped. If the first wide row is mostly numbers, the sheet has no header and the columns are named
Column 1,Column 2, and so on. - Pick the sheet. Every sheet is checked for coordinate columns, and the first sheet that has them is opened. A workbook without coordinates opens on its first sheet as a table.
- Detect the coordinates and the label. Column names are cleaned up and compared with the lists above. Every candidate pair is tested on up to 300 rows, and the pair with the most valid values wins. A name-like column becomes the label.
- Draw and colorize. Each row is read as decimal degrees or degrees-minutes-seconds, invalid rows are counted, and the points are drawn on a canvas layer. The color column is classified into categories or quantile classes, and the legend controls which classes are visible.
- Export. The visible points are written as GeoJSON with their colors in
marker-color, or as KML with one style per color and every column in ExtendedData.
Detection only makes a first guess. The sheet, the header row, the columns, the label and the colors can all be changed in the sidebar, and the map updates at once.
Behind the colors and the numbers
Three small pieces of math decide how the map looks and what the downloads contain.
1. Quantile classes
For graduated colors, the values are sorted and cut at the 20 %, 40 %, 60 % and 80 % positions. Each class then holds about one fifth of the points.
sorted values:  v(1) ≤ v(2) ≤ … ≤ v(n)
break k = v(⌊k · n / 5⌋ + 1)     for k = 1, 2, 3, 4

31 stores  →  breaks at the 7th, 13th, 19th and 25th smallest value
classes    →  6, 6, 6, 6 and 7 stores
Quantiles work well for skewed data like sales, where a few large values would push almost every point into the lowest class of equal-width intervals. When many points share the same value, two breaks can fall together; the tool then uses fewer classes.
2. KML writes colors backwards
Web colors are written as red, green, blue. KML writes alpha (opacity) first and then blue, green, red. Mixing up the two orders is a classic bug that turns blue points orange in Google Earth.
web hex   #2563eb   →  red 25, green 63, blue eb
KML       aabbggrr  →  ff  eb  63  25  →  ffeb6325
          (ff = fully opaque)
The tool converts every legend color this way, so the KML file looks the same in Google Earth as the map does here.
3. Shown value vs. stored value
A cell number format changes only what Excel shows, not what it stores. Rounding coordinates for display can move a point by hundreds of metres if the rounded value is used.
stored:   48.858412     (Eiffel Tower)
shown:    48.86         (number format 0.00)
error:    0.001588° × 111 320 m ≈ 177 m

worst case with 2 decimals:  0.005° × 111 320 m ≈ 557 m
This tool always reads the stored value. If you export the sheet as CSV from Excel, check the number format first, because the CSV gets the shown value.
When this tool helps
These are the situations where I use an Excel to map tool.
- Store and branch networks. Map shops, branches or depots, color them by type or by sales, and see the gaps in your coverage.
- Sales and customer lists. Put customer sites from a CRM export on the map and color them by region, account manager or revenue class.
- Field work and sampling. Survey points, sample sites and inspection results are usually kept in Excel. Map them with a color per status or result.
- Events and projects. Show venues, project sites or job locations from a planning sheet and share them as a KML file.
- Getting data into Google Earth. Turn a sheet into a KML file with colored placemarks and all columns in the info balloon, without writing XML by hand.
- Preparing data for a GIS. Get a clean GeoJSON file with typed numbers for QGIS, ArcGIS or a web map.
- Checking coordinates. Find rows with missing, out-of-range or swapped coordinates before the data goes into a report or an app.
- Teaching and presentations. Show students or colleagues how a table becomes a map, and how categories and classes change what the map says.
Frequently asked questions
1. How do I put Excel data on a map?
Click Upload Excel or drag the workbook onto the map. The tool finds the sheet with coordinates, the header row and the latitude and longitude columns, and draws every row as a point. Nothing is installed and nothing is uploaded.
2. Which columns does my sheet need?
A latitude column and a longitude column in decimal degrees (or degrees-minutes-seconds). All other columns are optional; they appear in the popups, can color the points and are included in the downloads.
3. My sheet only has addresses. Can I map it?
Not directly. This tool needs coordinates. Use the address-to-coordinates tool on this site to get latitude and longitude for your addresses, add them as two columns, and load the sheet again.
4. The wrong columns were picked. How do I change them?
Choose the latitude and longitude columns in the Coordinates panel, and the map updates at once. If the points land in the wrong part of the world, click Swap.
5. My workbook has several sheets. Which one is used?
The first sheet with coordinate columns. You can switch to any other sheet in the Sheet menu of the Workbook panel.
6. My table starts below a title. Does that work?
Yes. Title rows and empty rows above the header are skipped automatically. If the wrong row was taken as the header, choose the right one in the Header row menu.
7. How do I color the points by a column?
Choose a column under "Color by column". Text columns get one color per value; number columns get five graduated classes, which you can switch to "Each value". Click a legend entry to hide or show those points.
8. Will Google Earth show the same colors?
Yes. The KML file has one icon style per color, and each placemark uses the style of its class. Google My Maps reads the placemarks and their data too.
9. What is in the GeoJSON file?
One point feature per visible row, with every column as a property. Numbers are written as numbers, and when the points are colorized, each feature has a marker-color property.
10. Are hidden points included in the downloads?
No. Both downloads contain exactly the points you see on the map. Show all legend classes again to export everything.
11. Which file types can I open?
.xlsx, .xlsm, .xlsb and .xls workbooks, and .ods spreadsheets from LibreOffice, up to 50 MB. For CSV or TSV files, use the CSV to Map tool or the TSV Viewer on this site.
12. Is my workbook uploaded?
No. The file is read in your browser, and the downloads are created in your browser too. Only the basemap tiles are loaded from the internet.
Libraries and credits
The header detection, coordinate detection, colorizing and KML writer were written for this site. Reading the workbook and drawing the map use open source software.
- SheetJS Community Edition · Apache-2.0 · SheetJS LLCReads .xlsx, .xls, .xlsb and .ods workbooks in the browser, cell by cell.
- Leaflet 1.9 · BSD-2-Clause · Volodymyr Agafonkin and contributorsDraws the interactive map, the canvas point layer, the tooltips and the popups.
- OpenStreetMap, Protomaps (hosted by KONAKTIVE), CARTO, Esri World Imagery · ODbL and provider terms · OpenStreetMap contributors, Protomaps, KONAKTIVE, CARTO, EsriBasemap tiles and imagery.
Related tools
Workbooks are read in your browser and never uploaded to a server. The stores and sales in the sample workbook are invented; the coordinates are city centres rounded to 4 decimals. Map tiles © OpenStreetMap contributors, drawn with Protomaps (hosted by KONAKTIVE), with CARTO as the fallback. Satellite imagery: Esri.