What this viewer does
TopoJSON is a compact cousin of GeoJSON. It stores each shared border only once, and it usually writes coordinates as small whole numbers. That makes the files much smaller, which is why D3.js maps, election maps and many data journalism projects use it. The downside is that you cannot read a TopoJSON file by eye, and many GIS tools and web maps cannot open it without converting it first.
This viewer opens the file directly. Drop a .topojson or .json file on the map and it checks that the file is a real topology, rebuilds every shape from its arcs, and draws each named object as a separate layer with its own color. The sidebar shows how many objects, features and arcs the file has, whether it is quantized and how fine its grid is, and how much bigger the same data would be as plain GeoJSON. Click a feature to read its attributes, including its TopoJSON id.
I added one feature you will not find in a plain GeoJSON viewer: "Highlight shared borders". It draws only the arcs that two different features share, straight from the topology. This is the quickest way to check that a country, county or election map really has clean, shared borders without gaps or overlaps. When you need the data in another tool, download one object or all of them as GeoJSON. Nothing is uploaded: the file never leaves your computer.
TopoJSON vs GeoJSON
Both formats are JSON and both describe points, lines and polygons with attributes. The difference is how they store the coordinates.
| Aspect | TopoJSON | GeoJSON |
|---|---|---|
| Shared borders | Stored once as an arc, then referenced by every shape that uses it | Stored again in every polygon that touches it |
| Coordinates | Usually quantized integers, written as small differences (deltas) | Full decimal longitude and latitude for every vertex |
| File size | Often much smaller for polygons that touch each other | Larger, but simple to read |
| Layers | Several named objects in one file | One FeatureCollection per file |
| Topology | Knows which shapes are neighbours, so borders can be simplified together | No link between shapes |
| Support | D3.js, mapshaper, GDAL/QGIS (read only), this viewer | Almost every GIS and web map library |
| Standard | TopoJSON Format Specification 1.0 (community) | IETF RFC 7946 |
My rule of thumb: use TopoJSON when you ship many touching polygons to a browser, such as countries, states or districts, and size matters. Use GeoJSON for everything else, especially when other people or tools will edit the data.
What is inside a TopoJSON file
A TopoJSON file is one JSON object with the type "Topology". These are its main members:
- type
- Always
"Topology". A file that says"FeatureCollection"is GeoJSON, not TopoJSON. - objects
- A dictionary of named objects, for example
countriesandcapitals. Each one is a geometry or aGeometryCollection, and each becomes one layer in this viewer. - arcs
- The shared list of lines. Polygons and lines do not hold coordinates themselves. They list the index numbers of the arcs that form them.
- transform
- Optional. When present, the file is quantized: arc positions are integers, and
scaleandtranslateturn them back into longitude and latitude. - bbox
- Optional. The bounding box of all data, as [min x, min y, max x, max y].
- properties, id
- Each geometry can carry
properties(the attributes) and anid, the same as a GeoJSON feature.
Here is a complete, very small topology with two square fields that touch. It is the same example the math section below works through.
{
  "type": "Topology",
  "transform": { "scale": [0.001, 0.001], "translate": [-10, 40] },
  "objects": {
    "fields": {
      "type": "GeometryCollection",
      "geometries": [
        { "type": "Polygon", "arcs": [[0, 1]],  "properties": { "name": "A" } },
        { "type": "Polygon", "arcs": [[2, -1]], "properties": { "name": "B" } }
      ]
    }
  },
  "arcs": [
    [[4000, 7000], [0, 1000]],
    [[4000, 8000], [-1000, 0], [0, -1000], [1000, 0]],
    [[4000, 7000], [1000, 0], [0, 1000], [-1000, 0]]
  ]
}
Field A uses arcs 0 and 1. Field B uses arc 2 and then -1. A negative index means "use this arc backwards": -1 is arc 0 reversed, because the number is the ones' complement ~0. The border between the fields (arc 0) is written only once.
Technical details
This is exactly what the viewer reads and shows.
- Accepted files
.topojsonand.jsonfiles with"type": "Topology", up to 100 MB. A GeoJSON file gets a clear message that points you to the GeoJSON Viewer.- Geometry types
- Point, MultiPoint, LineString, MultiLineString, Polygon, MultiPolygon and GeometryCollection, including null geometries (they are skipped).
- Objects
- Every named object becomes its own layer, with a checkbox, a color, its geometry type, feature count, field count and a GeoJSON download.
- Quantized files
- Fully supported. The viewer reads
transform, decodes the delta-encoded integers and shows the size of one grid step on the ground in metres. - Shared borders
- For objects with polygons, the viewer builds the mesh of arcs used by two different features (
topojson.meshwitha !== b) and can draw it on top. - Attributes
- All
propertiesare shown in the popup. A TopoJSONidis added as anidattribute so you can see it and it survives the export. - Coordinate system
- TopoJSON for web maps is normally in WGS84 longitude and latitude. Files that were projected before conversion (for example US Albers for a D3 map) are not in degrees and cannot be placed on a world map.
- Export
- Each object as its own GeoJSON file, or all objects in one GeoJSON file with a
topojson_objectattribute that says where each feature came from. - Basemap
- Street map by default, with a satellite option. Turn on fill opacity 0 to see only the outlines.
- Privacy
- The file is read and decoded in your browser. Nothing is sent to a server.
How to view a TopoJSON file, step by step
Here is the whole workflow with the built-in sample: 50 European countries from Natural Earth and 22 capital cities, stored as one quantized topology with two objects.
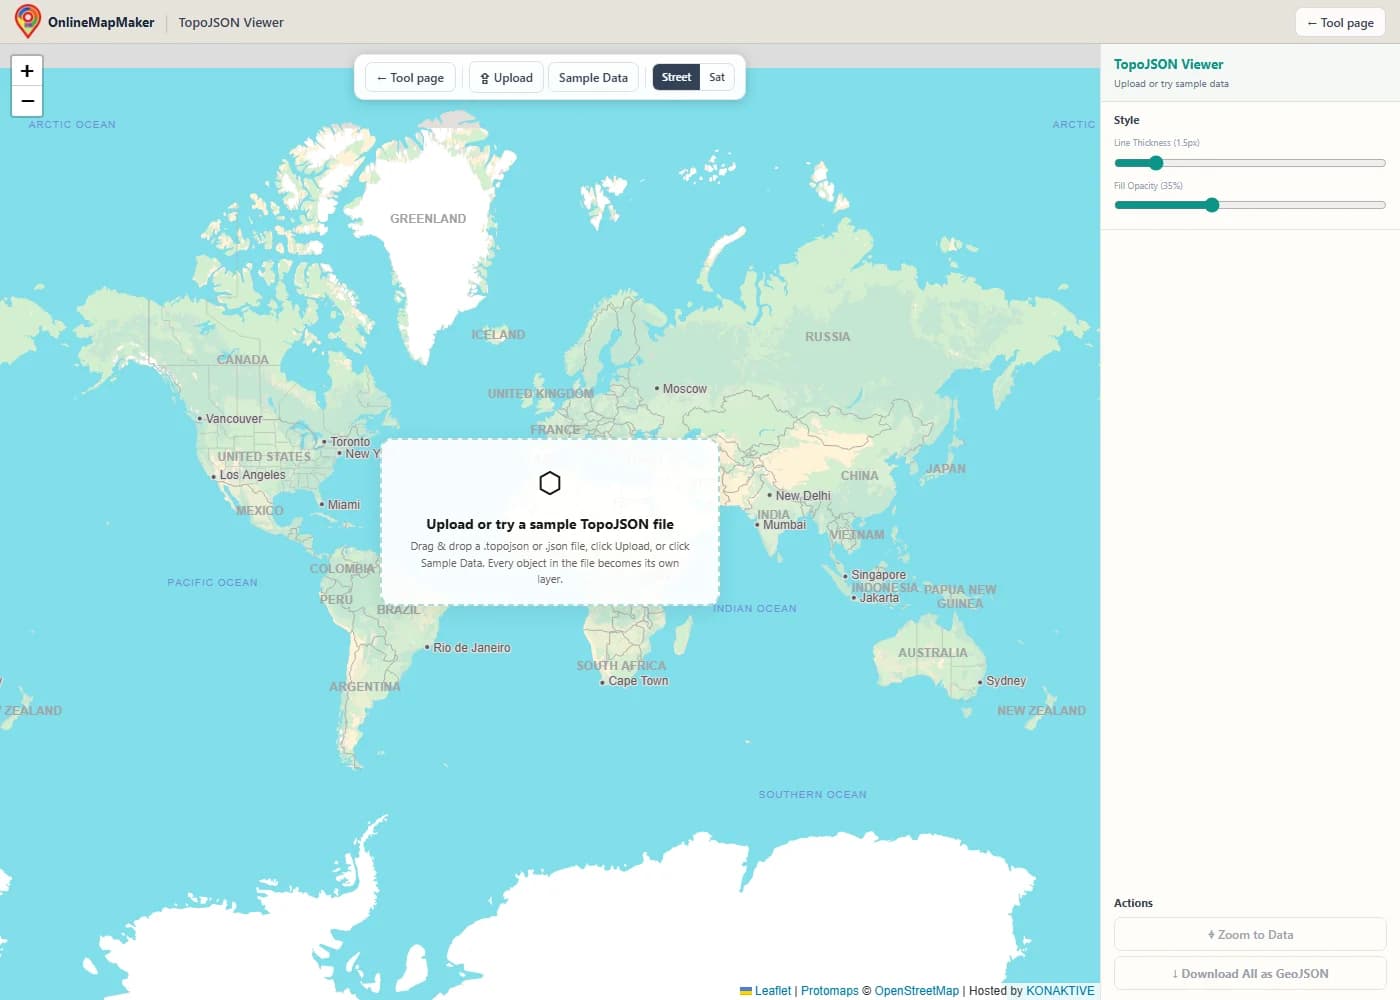
The map opens with a street basemap. Use Upload, drag and drop a file onto the map, or click Sample Data.
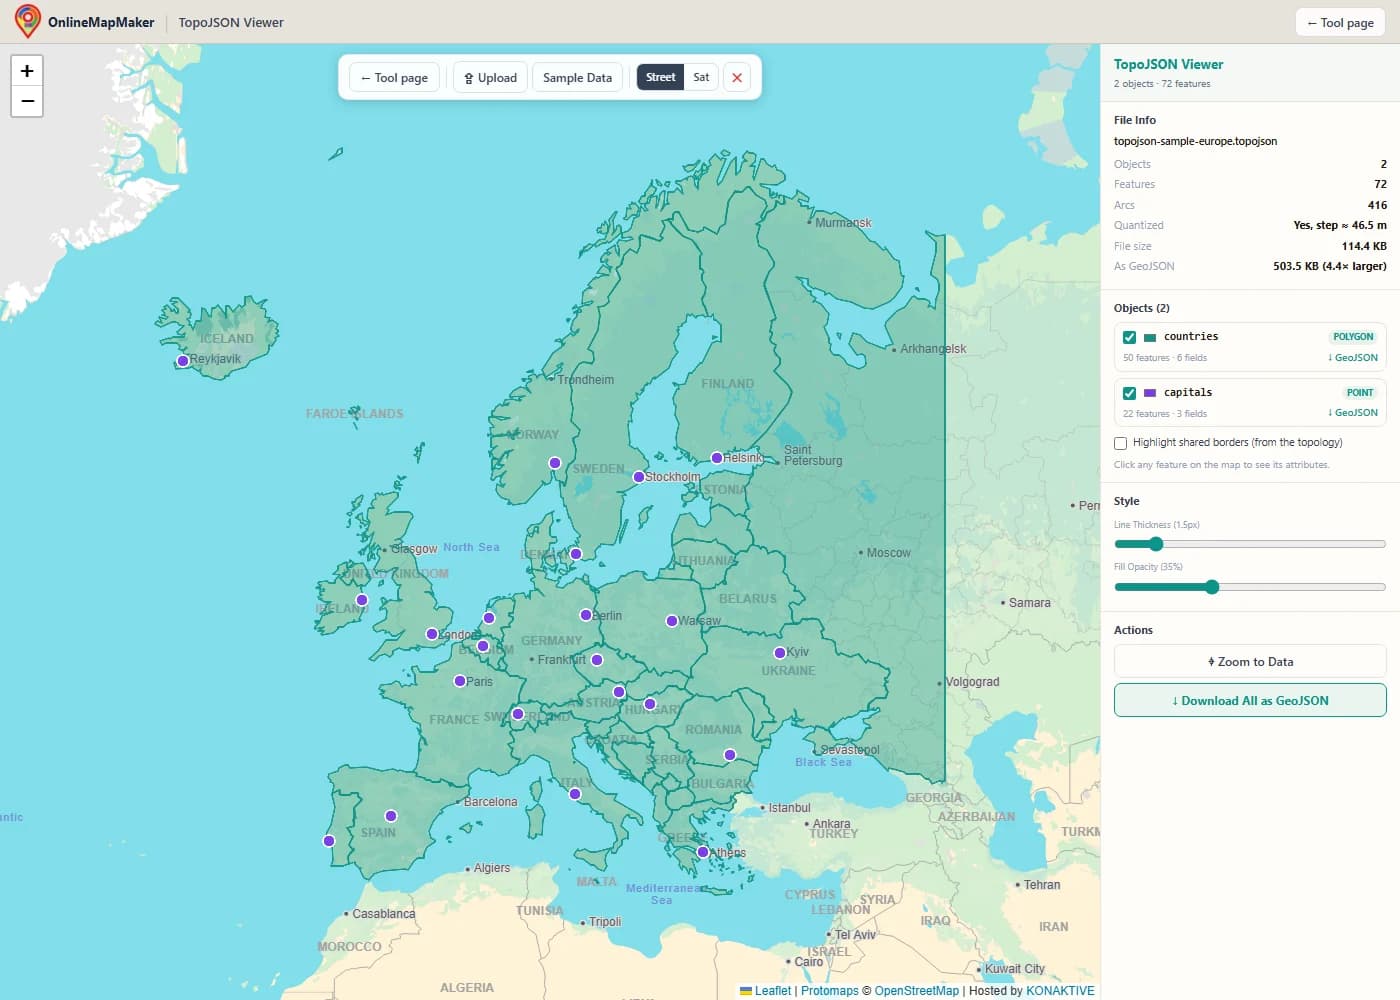
The file is decoded in your browser and every object is drawn in its own color. File Info shows the number of objects, features and arcs, the quantization step, and how large the same data would be as GeoJSON.
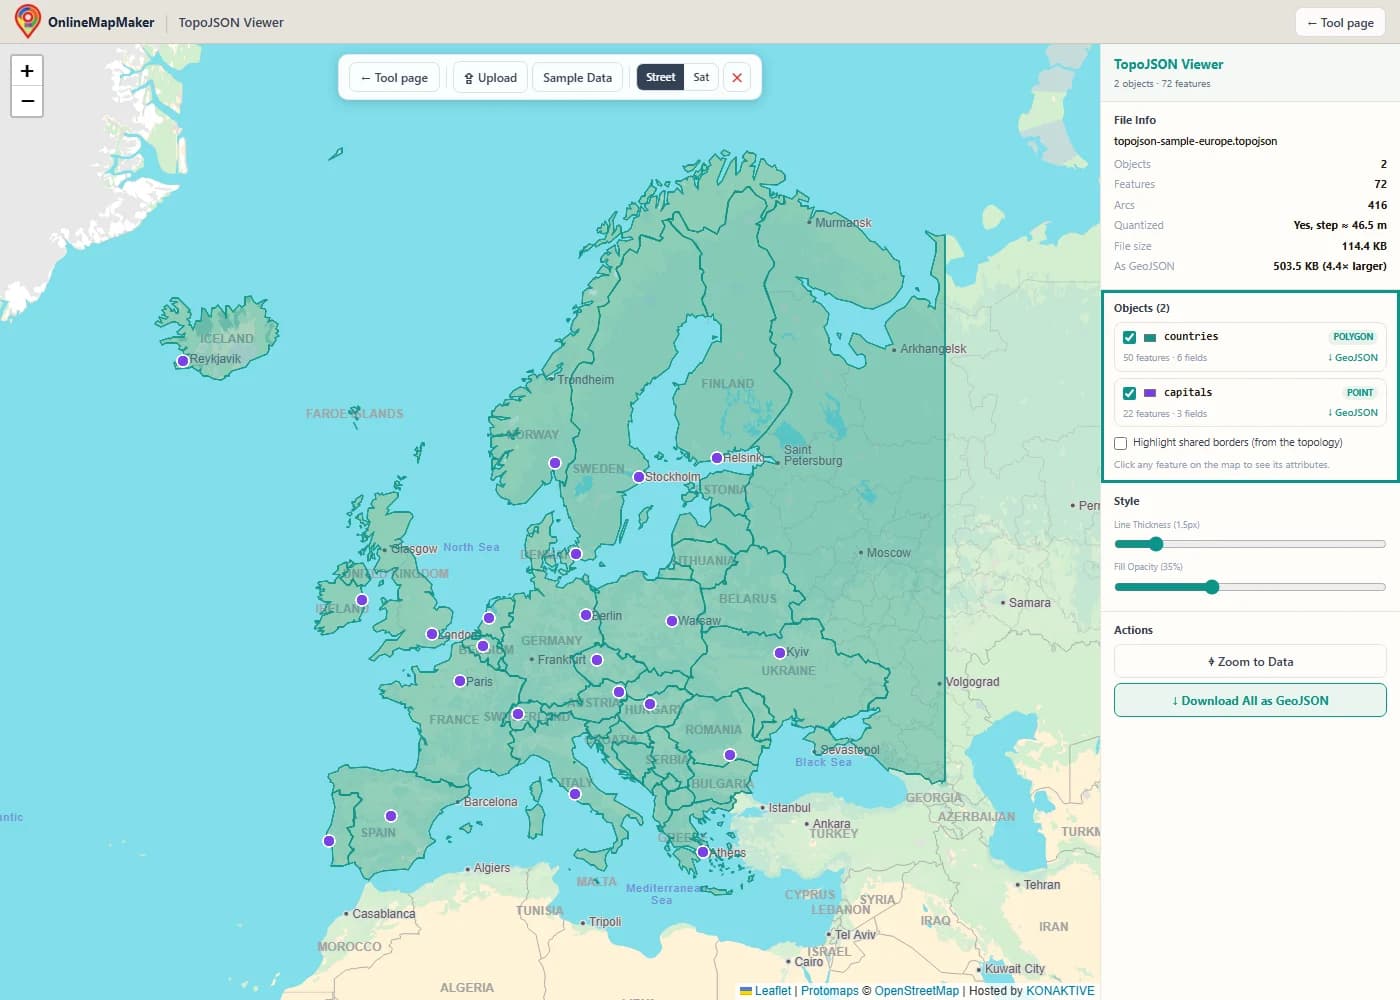
The Objects panel lists each object in the topology with its geometry type and feature count. Untick an object to hide it, or click its color square to change the color.
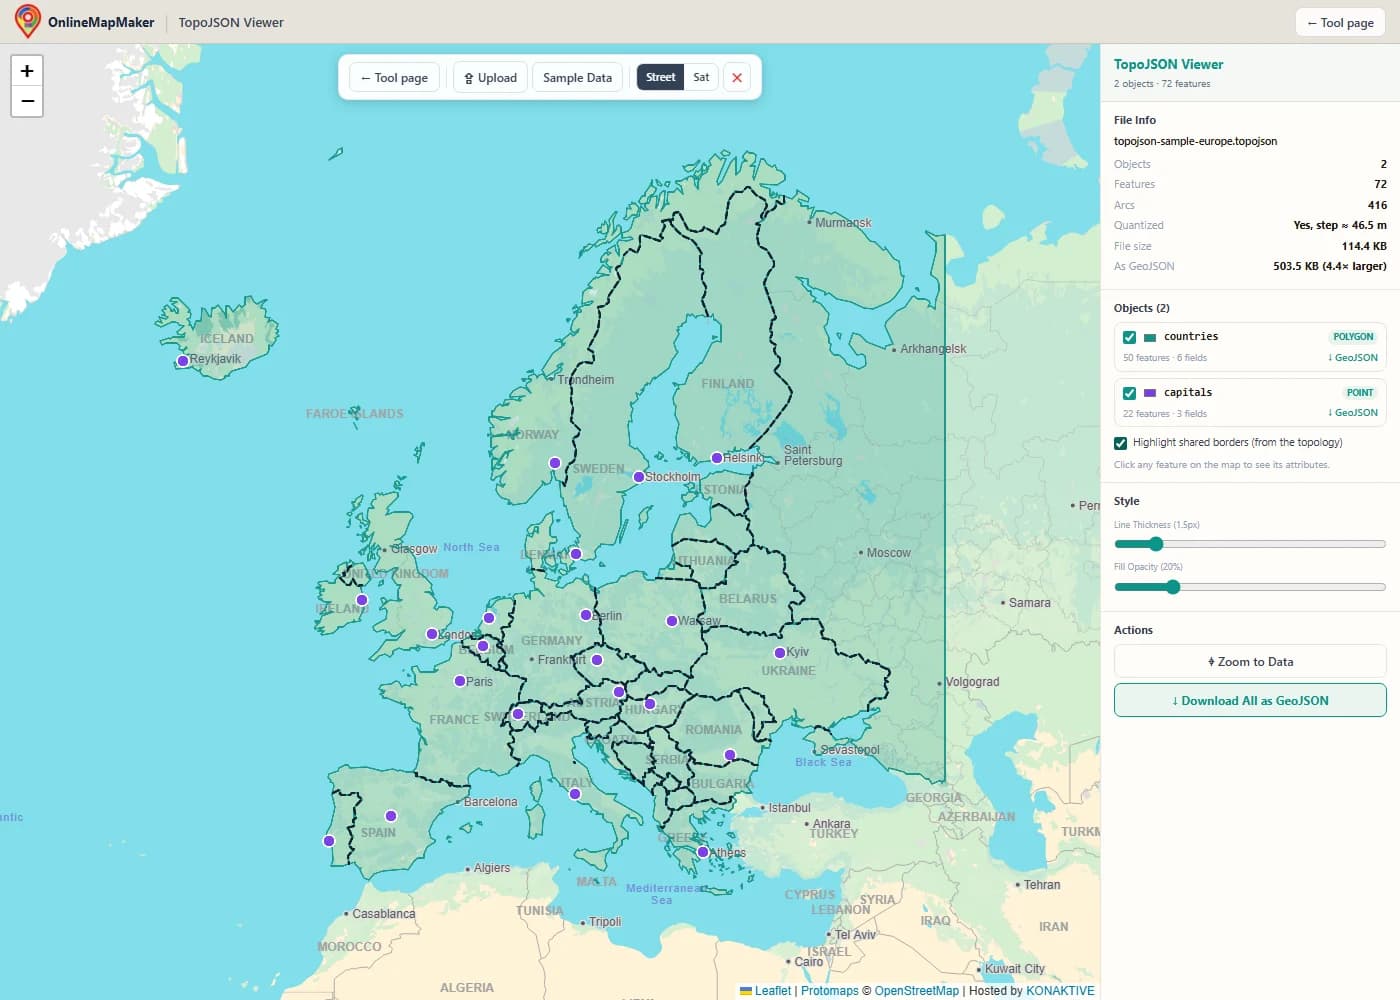
Tick "Highlight shared borders" to draw the arcs that two different features share, built from the topology itself. Coastlines are not shared, so they stay plain.
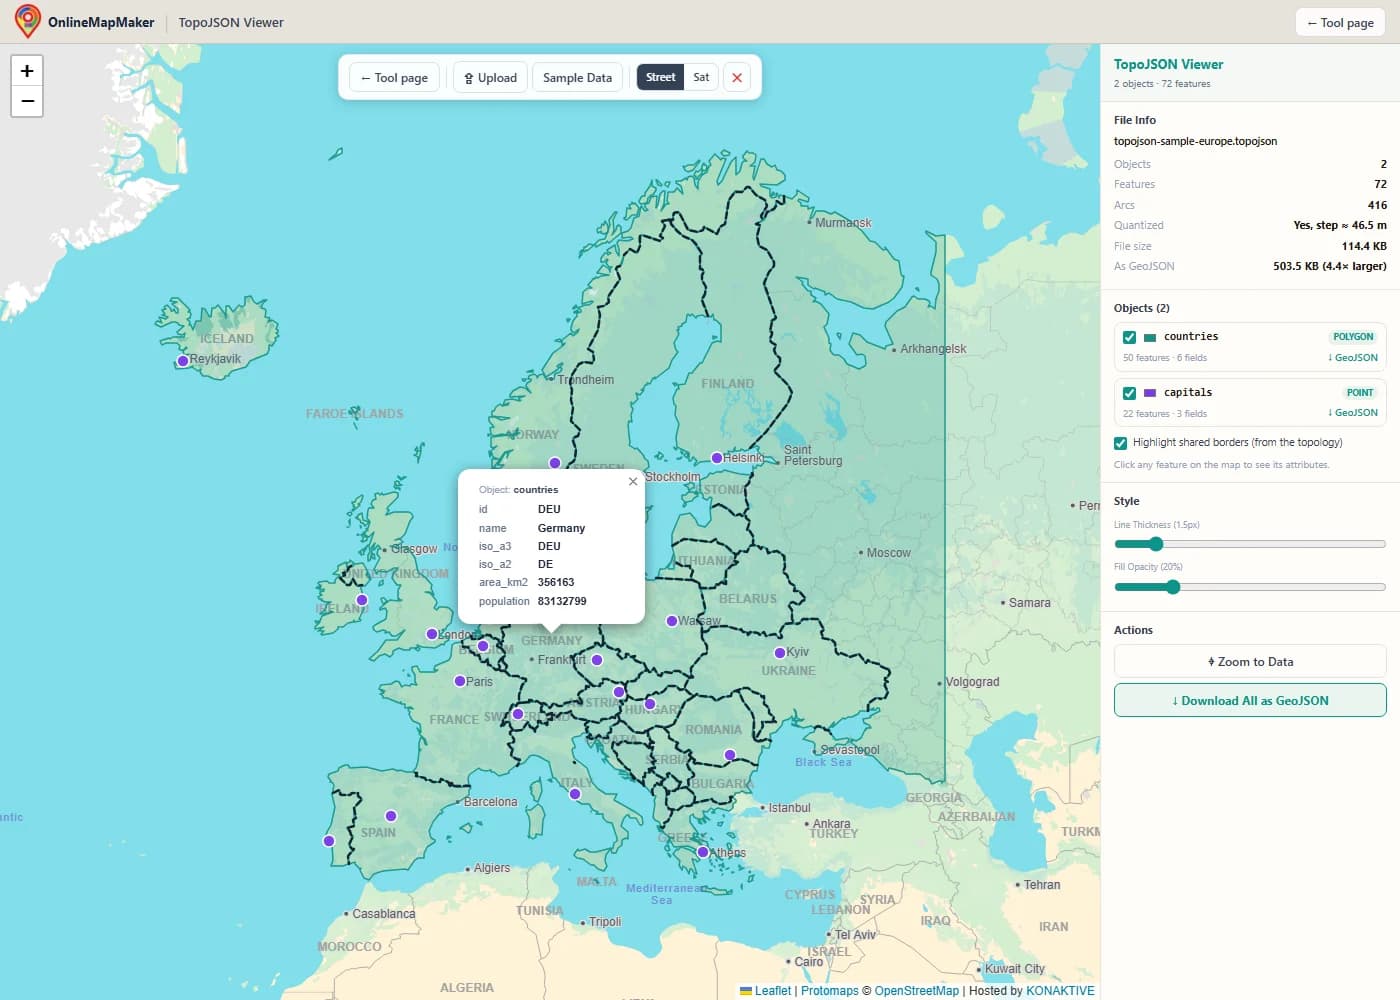
Click any feature to open its attributes. The popup also names the object it belongs to and shows the TopoJSON id.
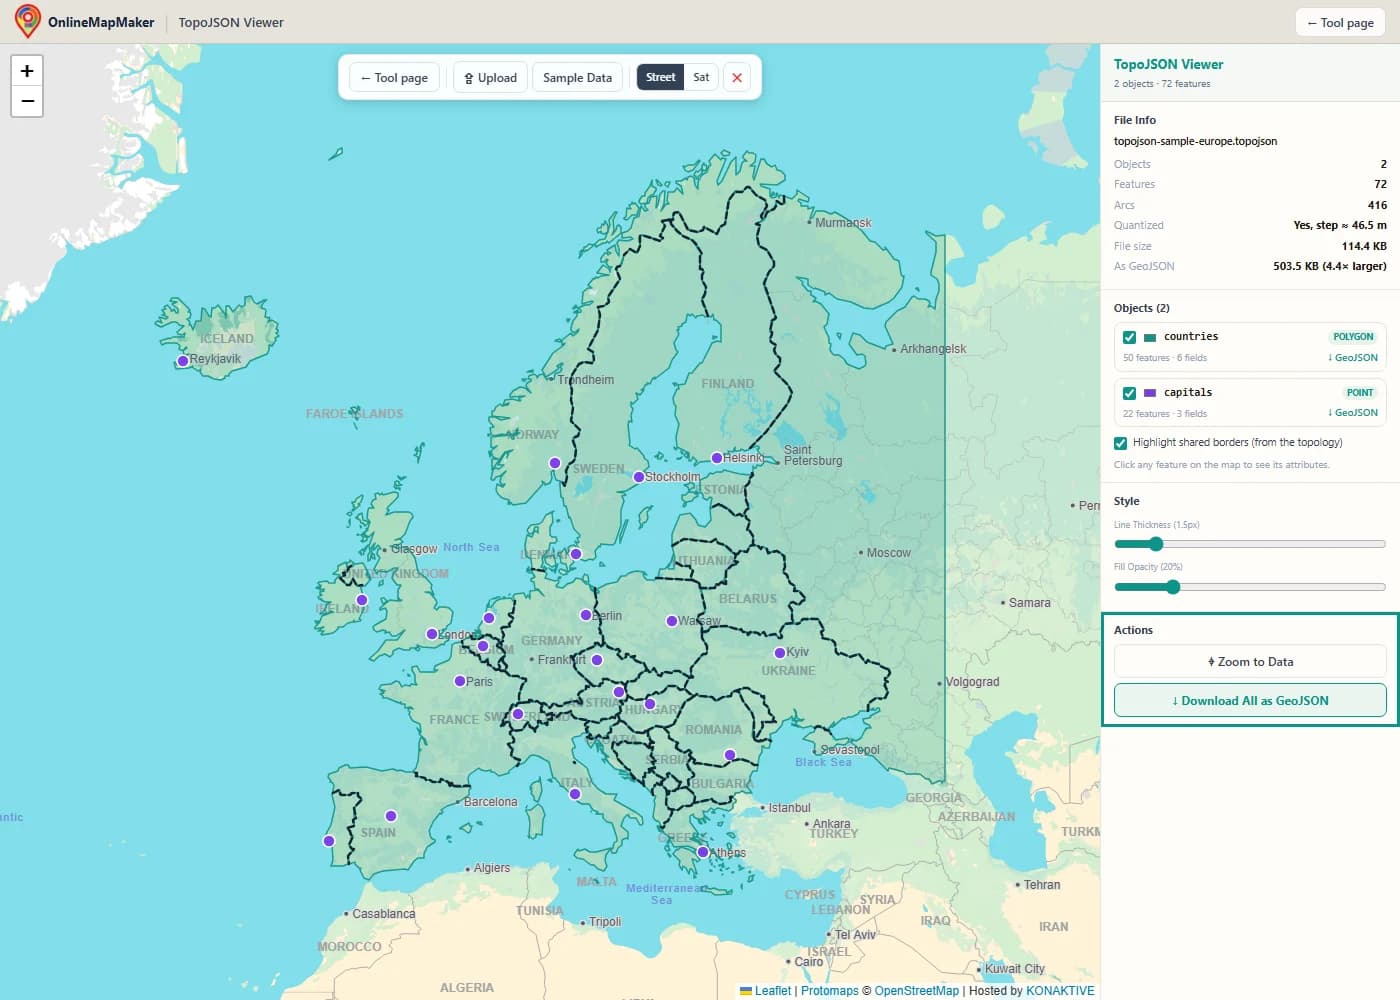
Use the GeoJSON link next to an object to download just that object, or Download All as GeoJSON for everything in one file.
Other ways to open and convert TopoJSON
This viewer is for looking at a file quickly. These are the other tools I use when a TopoJSON file needs real work.
mapshaper
mapshaper (the website mapshaper.org or the command line tool) reads and writes TopoJSON, Shapefile, GeoJSON and CSV. It is the best tool for simplifying borders while keeping them shared, and for converting between TopoJSON and other formats.
QGIS and GDAL
GDAL has a read-only TopoJSON driver, so QGIS can open a TopoJSON file by drag and drop. Each object appears as a separate layer. To save it, export the layer to GeoJSON or GeoPackage. ogr2ogr converts on the command line.
The topojson command line tools
geo2topo (from topojson-server) builds a topology from GeoJSON files, toposimplify (from topojson-simplify) and topoquantize (from topojson-client) make it smaller, and topo2geo (also from topojson-client) turns objects back into GeoJSON.
D3.js and Python
In a browser, topojson.feature turns an object into GeoJSON for D3 or any map library, and topojson.mesh gives you shared borders. In Python, GeoPandas reads TopoJSON through GDAL, one object (layer) at a time.
The same jobs in code
These commands convert a countries file in both directions and read it in JavaScript and Python.
# mapshaper (npm install -g mapshaper)
mapshaper countries.shp -o format=topojson quantization=1e5 countries.topojson
mapshaper countries.topojson -o format=geojson countries.geojson

# topojson-server / topojson-client command line tools
geo2topo countries=countries.geojson > countries.topojson
topo2geo countries=countries.geojson < countries.topojson

# GDAL / OGR: each TopoJSON object becomes its own layer
ogrinfo countries.topojson
ogr2ogr -f GeoJSON countries.geojson countries.topojson countries
// D3.js + topojson-client in the browser
const topo = await d3.json("countries.topojson");
const countries = topojson.feature(topo, topo.objects.countries);
const borders = topojson.mesh(topo, topo.objects.countries, (a, b) => a !== b);

# Python: GeoPandas reads TopoJSON through GDAL, one object at a time
import geopandas as gpd
countries = gpd.read_file("countries.topojson", layer="countries")
My take: keep your master data in GeoJSON, GeoPackage or Shapefile, and build the TopoJSON as the last step for the web. It is easy to rebuild, but hard to edit by hand.
How the viewer works
This is what happens between dropping a file and seeing it on the map. Every step runs in your browser.
- Read and check the JSON. The file is read as text and parsed. If the top-level
typeis not"Topology", orobjectsorarcsis missing, you get a clear error instead of an empty map. - Decode the arcs. If the file has a
transform, every arc is decoded from delta-encoded integers back to longitude and latitude. Without a transform, the arc positions are used as they are. - Rebuild each object. For each named object,
topojson.featurejoins the referenced arcs into rings and lines, reverses arcs with negative indexes, and returns a GeoJSON FeatureCollection with the original properties and ids. - Build the shared-border mesh. For objects with polygons,
topojson.meshwith the filtera !== bcollects every arc that belongs to two different features. Arcs used by only one feature, such as coastlines, are left out. - Measure the file. The viewer counts objects, features and arcs, works out the size of one quantization step in metres, and measures how big the decoded GeoJSON would be.
- Draw and fit. Each object becomes a Leaflet layer with its own color. Points are drawn as circles. The map zooms to all visible data.
The decoding itself is done by topojson-client, the reference library written by the creator of the format, so the viewer reads files exactly the way D3 maps do.
How TopoJSON makes files smaller
TopoJSON saves space in three ways: shared arcs, quantization and delta encoding. Here is the math for each, with the example topology from above.
1. Shared arcs
In GeoJSON, a border between two polygons is written twice, once in each polygon. TopoJSON cuts every boundary into arcs at the points where three or more shapes meet, stores each arc once, and lets every polygon list the arcs it uses. A negative index uses the arc backwards.
index  i ≥ 0  →  arc i, first point to last point
index  i < 0  →  arc ~i = −i − 1, last point to first point

Field A ring:  [0, 1]    = arc 0, then arc 1
Field B ring:  [2, −1]   = arc 2, then arc 0 reversed
For a country map, most of the length of every border is shared by exactly two countries, so this step alone removes close to half of the border coordinates.
2. Quantization
Quantization snaps every coordinate to a regular grid and writes the grid cell as an integer. With a quantization of q, the bounding box is split into q − 1 steps along each axis. The transform stores the grid size (scale) and the corner of the grid (translate).
scale_x = (x_max − x_min) / (q − 1)
scale_y = (y_max − y_min) / (q − 1)

longitude = x_integer · scale_x + translate_x
latitude  = y_integer · scale_y + translate_y
The sample file uses q = 100 000 over Europe and western Russia, about 69° of longitude and 36° of latitude. One step is about 0.0007° east to west, roughly 44 m at 55° north, and about 40 m north to south. That is far finer than the 1:50m source data, so no visible detail is lost. The File Info panel shows this step for your own files.
3. Delta encoding
Inside each arc, only the first position is written as a full integer. Every next position is written as the difference from the one before. Neighbouring points are close together, so the differences are small numbers with few digits.
stored arc:   [[4000, 7000], [0, 1000]]

point 1:  x = 4000             y = 7000
point 2:  x = 4000 + 0 = 4000  y = 7000 + 1000 = 8000

with scale [0.001, 0.001] and translate [−10, 40]:
point 1:  (4000 · 0.001 − 10,  7000 · 0.001 + 40) = (−6, 47)
point 2:  (4000 · 0.001 − 10,  8000 · 0.001 + 40) = (−6, 48)
So arc 0 of the example is the line from (−6, 47) to (−6, 48): the border between field A and field B. Decoding all three arcs gives the two squares A = (−7…−6, 47…48) and B = (−6…−5, 47…48). This is exactly the case the viewer's own tests check, together with the shared-border mesh, which returns only that one border line.
4. What it adds up to
For the sample in this viewer, the original GeoJSON with 4 decimal places is about 211 KB, and the TopoJSON is about 114 KB, roughly half. When the viewer decodes the TopoJSON back to GeoJSON with full decimal numbers, it grows to about 500 KB, which is the number the File Info panel shows. After gzip compression, which every web server uses, the gap usually gets smaller but stays clear for maps with many shared borders.
When a TopoJSON viewer helps
These are the situations where I reach for a quick TopoJSON viewer.
- Checking a file before you build a D3 map. See which objects a downloaded TopoJSON file holds, what they are called and which attributes they have, so you know what to write in `topo.objects` before you start coding.
- Checking borders after simplification. After simplifying a map in mapshaper or toposimplify, turn on "Highlight shared borders" to confirm that neighbours still share one clean border, with no gaps or slivers.
- Getting GeoJSON out of a TopoJSON file. Many web maps and GIS tools only take GeoJSON. Download one object or the whole file as GeoJSON without installing anything.
- Reviewing election and census maps. Newsrooms often publish district and county boundaries as TopoJSON. Open the file to check the district names, ids and coverage before you join your results to it.
- Comparing quantization levels. Open the same map built with different quantization settings and compare the step size in metres and the file size, to choose the smallest file that still looks right.
- Teaching how topology works. The object list, the arc count and the shared-border view make it easy to show students why a topology is smaller than plain GeoJSON.
- Opening files from the world-atlas and us-atlas packages. These popular npm packages ship TopoJSON for countries, US states and counties. Open them here to see exactly what they contain.
- Finding out why a file will not load. If a map library fails on a file, the viewer tells you whether it is really TopoJSON, GeoJSON with the wrong extension, or a file with broken arc references.
Frequently asked questions
1. What is TopoJSON?
TopoJSON is an extension of GeoJSON that stores geometry as a topology. Shared borders are stored once as arcs, and coordinates are usually quantized to integers. It was created by Mike Bostock, the author of D3.js, to make map files for the web smaller.
2. How do I open a TopoJSON file?
Drop it on the map in this viewer, or click Upload. In QGIS you can drag it into the map window, because GDAL reads TopoJSON. In code, use topojson.feature from topojson-client to turn each object into GeoJSON.
3. What is the difference between TopoJSON and GeoJSON?
GeoJSON writes full coordinates for every shape, so a shared border appears twice. TopoJSON writes each border once as an arc and lets shapes reference it, and usually stores coordinates as small integers. TopoJSON files are smaller; GeoJSON files are simpler and supported almost everywhere.
4. How do I convert TopoJSON to GeoJSON?
Load the file here and click Download All as GeoJSON, or use the GeoJSON link next to one object. On the command line, topo2geo or mapshaper -o format=geojson do the same job.
5. My file has several objects. What happens to them?
Each object becomes its own layer with its own color and checkbox. You can download each object as a separate GeoJSON file, or all of them together. The combined file adds a topojson_object attribute to every feature.
6. What does "Highlight shared borders" show?
It draws the arcs that are used by two different features of the same object, for example the border between two countries. Arcs used by only one feature, such as coastlines, are not drawn. It is the same as topojson.mesh(topology, object, (a, b) => a !== b) in D3.
7. What does "quantized" mean in the File Info panel?
It means the file has a transform, so its coordinates are integers on a grid. The panel shows how big one grid step is on the ground. A step of a few metres is fine for a city map; a step of a few hundred metres is fine for a world map.
8. Why is my map in the wrong place or very small?
Some TopoJSON files, especially those made for D3 maps of the United States, are projected before conversion, so their coordinates are screen pixels, not longitude and latitude. Such a file cannot be placed on a world map. Use the unprojected version of the data instead.
9. Why do I get a message that my file is GeoJSON?
Many TopoJSON files use the .json extension, and so do GeoJSON files. The viewer checks the content, not the name. If the file starts with "type": "FeatureCollection", it is GeoJSON. Open it in the GeoJSON Viewer on this site.
10. Is my file uploaded?
No. The file is read and decoded in your browser with topojson-client. Only the basemap tiles come from the internet.
Libraries and data
This viewer is built on open source software and open data. Many thanks to the people behind these projects.
- topojson-client 3.1 · ISC · Mike BostockDecodes the topology: turns arcs back into coordinates, rebuilds each object as GeoJSON, and builds the shared-border mesh.
- Leaflet 1.9 · BSD-2-Clause · Volodymyr Agafonkin and contributorsDraws the interactive map, the layers and the popups.
- Natural Earth (1:50m Admin 0 countries) · Public domain · Natural Earth contributorsCountry borders used in the sample file.
- OpenStreetMap, Protomaps (hosted by KONAKTIVE), CARTO, Esri World Imagery · ODbL and provider terms · OpenStreetMap contributors, Protomaps, KONAKTIVE, CARTO, EsriBasemap tiles and imagery.
Related GIS file viewers
TopoJSON files are read and decoded in your browser. No file is ever uploaded to a server. The sample uses Natural Earth data (public domain). Map tiles © OpenStreetMap contributors, drawn with Protomaps (hosted by KONAKTIVE), with CARTO as the fallback. Satellite imagery: Esri.