

What the identity overlay does
Identity is a vector overlay. You give it two layers. The input layer holds the features you want to keep, for example land parcels, roads or well points. The identity layer holds polygons with attributes, for example flood zones, zoning districts or soil types. The tool does two jobs at once. Where an input feature overlaps an identity polygon, it cuts out that piece and copies the polygon attributes onto it. Where the input feature overlaps nothing, it keeps that piece and leaves the identity fields empty.
The result always covers the full input layer. No input area, line length or point is lost, which is the big difference to Intersect (it drops everything outside the overlap) and to Union (it also adds the identity polygons that touch no input). Every output piece carries all attributes of its input feature. The pieces inside an identity polygon also carry that polygon's attributes. In formula form: Identity(A, B) = Intersect(A, B) + Erase(A, B). This is the same rule as the Identity tool in ArcGIS Pro and in the old ARC/INFO.
I built this tool because "split my parcels by zone and keep both attribute tables" is a daily task, and the usual answer is a desktop GIS with the right licence. Drop a zipped Shapefile, GeoJSON, KML, KMZ, GPX or WKT file on the map, or draw your own shapes. Pick the input layer and the identity layer, click Run Identity, and download the result. All the geometry math runs in your browser, so your files stay on your computer. The map starts without a basemap, which keeps it fast, and you can turn on a street or satellite basemap at any time.
Identity, Union, Intersect, Erase and Spatial Join: which one do you need?
Overlay tools are easy to mix up because they all combine two layers. The difference is which geometry they keep and which attributes end up in the output. This table puts them side by side for an input layer A and an overlay layer B.
| Tool | Geometry kept | Attributes in the output |
|---|---|---|
| Identity (this tool) | All of A, cut by B | A everywhere, plus B where they overlap, empty B fields elsewhere |
| Union | All of A and all of B, cut where they overlap | A and B where they overlap, only one side elsewhere |
| Intersect | Only the part where A and B overlap | A and B together |
| Erase | The parts of A outside B | Only A |
| Clip | The parts of A inside B | Only A |
| Symmetric Difference | The parts of A outside B and the parts of B outside A | A and B, each on its own parts |
| Spatial Join | A unchanged, no cutting | A plus attributes of the B feature found by location |
A quick way to choose: if you must keep the full input and also want to know what zone, district or class each part falls in, use Identity. If you only care about the overlap, use Intersect. If you do not want your features cut at all, use a spatial join instead.
Other names for the identity overlay
The same operation has different names in different software, and people search for all of them. Here is where each name points.
| Name you may know | Where you see it | What it means |
|---|---|---|
| Identity | ArcGIS Pro, ArcMap, arcpy | The original name. Analysis toolbox > Overlay > Identity, and arcpy.analysis.Identity. |
| Overlay with how="identity" | GeoPandas | geopandas.overlay(df1, df2, how="identity") returns the same pieces and fields. |
| Intersection + Difference, merged | QGIS | QGIS has no tool called Identity. Run Intersection and Difference, then merge the two outputs. |
| Union, then drop the identity-only parts | QGIS, ArcGIS | Union keeps B-only polygons as well. Remove them and you get an identity result. |
| st_intersection + st_difference | R (sf package) | The two halves of an identity, bound together with rbind. |
| ST_Intersection + ST_Difference | PostGIS | The same two halves in SQL, joined with UNION ALL. |
| Vector overlay, polygon overlay, overlay analysis | GIS textbooks | The general topic. Identity is one of the standard overlay operations, next to union, intersect, erase and clip. |
| Attribute transfer by overlay, zone tagging | Planning and environmental work | Plain-language names for what Identity is used for: tag each part of a feature with the zone it sits in. |
If you were looking for "how do I split a shapefile by another shapefile and keep both attribute tables", this is the tool.
Supported file formats
You can load several files at once, and you can mix formats. Each file becomes its own layer in the Layers panel. An input layer can hold points, lines and polygons together, and each of them is handled with the right method.
Input formats (what you can upload)
| Format | Extension | Notes |
|---|---|---|
| GeoJSON | .geojson, .json | A FeatureCollection, a single Feature or a bare geometry. A GeometryCollection is split into its parts. |
| Esri Shapefile | .zip | Zip the .shp, .shx and .dbf files together. Add the .prj file and projected data is converted to WGS84 when it loads. A .cpg file sets the text encoding. |
| KML | .kml | Google Earth placemarks. MultiGeometry is split into its parts, and ExtendedData becomes attributes. |
| KMZ | .kmz | A zipped KML file. The first .kml file inside the archive is read. |
| GPX | .gpx | GPS files. Waypoints become points, and tracks and routes become lines. Elevation values are kept. |
| WKT | .wkt, .txt | Well-Known Text. One geometry for the whole file, or one geometry per line. |
Output formats (what you can download)
| Format | Extension | Notes |
|---|---|---|
| GeoJSON | .geojson | The standard web format (RFC 7946) in WGS84. Keeps every attribute and its type. Opens in ArcGIS Pro, QGIS and almost every web map library. |
| KML | .kml | Opens in Google Earth. Attributes are written as ExtendedData on each placemark. |
| CSV (WKT) | .csv | One row per feature. The first column holds the geometry as WKT, and each attribute gets its own column. Opens in Excel, and QGIS can read the WKT column as geometry. |
Each file can be up to 50 MB. For very large national datasets, a desktop GIS is still the better choice. See the comparison further down this page.
Technical details
Here is exactly what the tool does with your data. If you know Identity in ArcGIS Pro, most of this will look familiar.
- Input geometry types
- Point, MultiPoint, LineString, MultiLineString, Polygon and MultiPolygon. One layer can mix all of them.
- Identity geometry types
- Polygon and MultiPolygon, with or without holes. A layer without polygons cannot be picked as the identity layer.
- Several identity polygons
- The identity layer is not merged. Each polygon keeps its own attributes. Where two identity polygons overlap, the input is cut once for each of them, so the overlap shows up twice, once with each set of attributes. This is how ArcGIS Identity works.
- Attributes
- Every attribute of the input feature is copied to every output piece. The attributes of the identity polygon are added as new fields. Pieces that fall outside all identity polygons get empty (null) values in those fields.
- Field name clashes
- If an identity field has the same name as an input field, the input field keeps its name and the identity field gets a suffix:
namebecomesname_1, thenname_2, and so on. The results box lists every renamed field. - Tracking fields
- As an option, the tool adds
FID_input(the position of the input feature, starting at 0),FID_identity(the position of the identity polygon, or -1 when there is none),identity_status(overlap or input_only), andidentity_area_m2,identity_length_moridentity_pointsfor each piece. - Coordinate system
- WGS84 longitude and latitude (EPSG:4326), the same as GeoJSON. A zipped Shapefile with a .prj file is converted to WGS84 when it loads.
- Geometry model
- Cutting is done on a flat plane in degrees, the same model that Turf.js and most web GIS libraries use. Areas and lengths in the results panel are measured on the sphere (geodesic), in square metres and metres.
- Boundary rule
- The edge of an identity polygon counts as inside. A point exactly on the edge gets the attributes of that polygon, and so does a line piece that runs along the edge. A polygon that only touches the edge from outside is not cut.
- Multipart output
- If an overlay cuts one feature into several parts with the same attributes, the parts stay together as one multipart feature (MultiLineString, MultiPolygon or MultiPoint). Tick "Split multipart results" to get one feature per part.
- Invalid geometry
- If the geometry math fails for one input feature, that feature is skipped and counted, and the rest of the layer is still processed.
- Privacy
- Everything runs in your browser. No file and no geometry is sent to a server.
How to use the identity overlay tool, step by step
Here is the whole workflow with the built-in sample data: a city layer with parcels, roads and points, and three flood-zone polygons that carry a zone name, a risk level and a flood depth. Your own files work the same way.
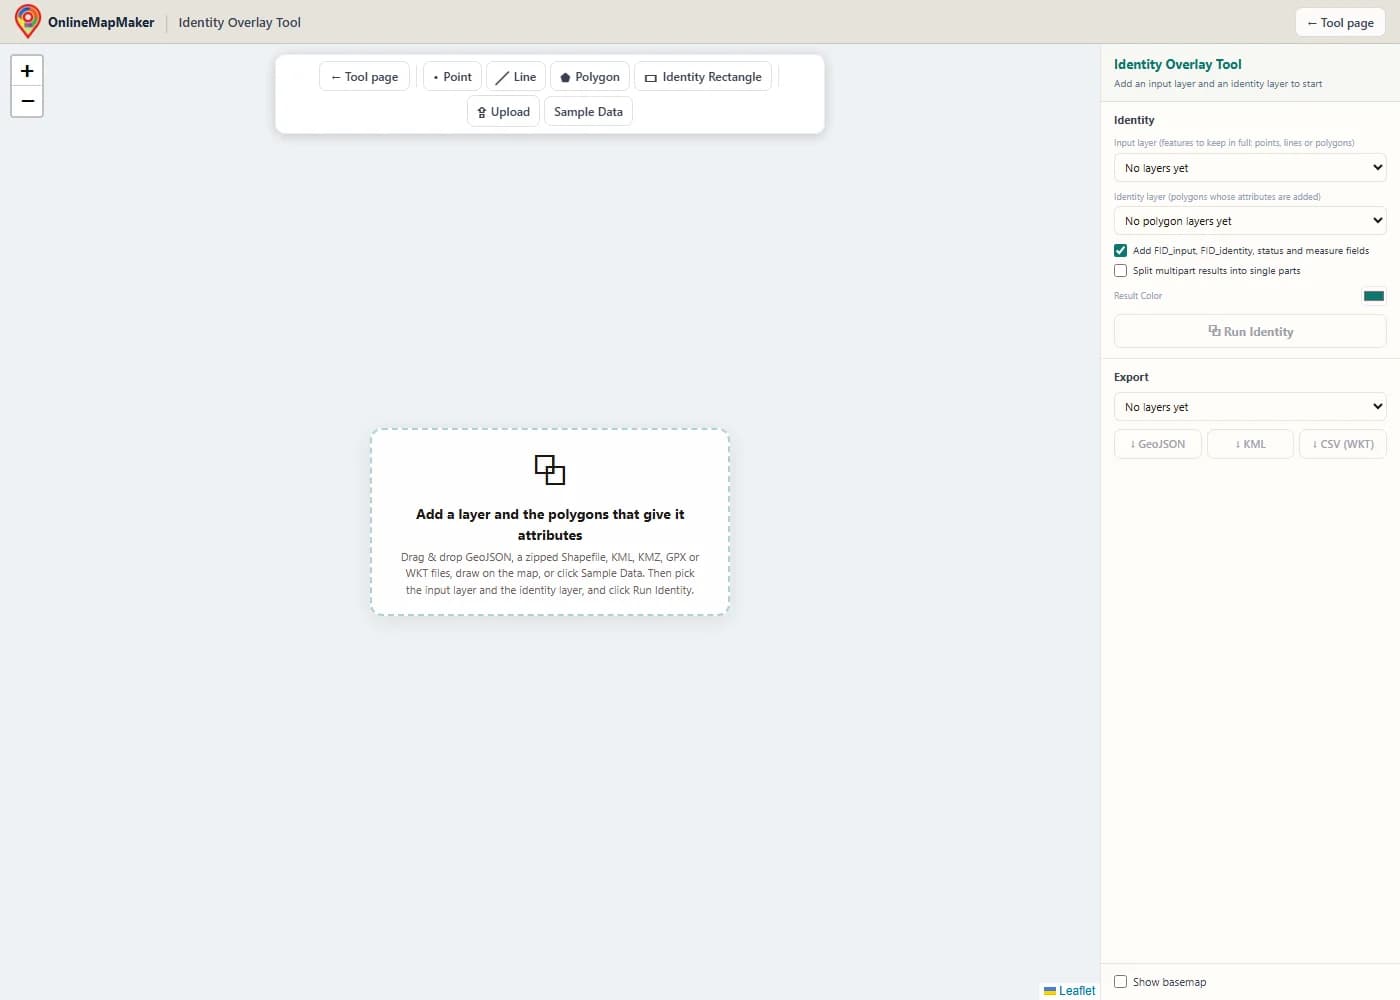
The map opens empty and without a basemap, so nothing loads that you do not need. The toolbar has Point, Line, Polygon and Identity Rectangle drawing tools, an Upload button and a Sample Data button.
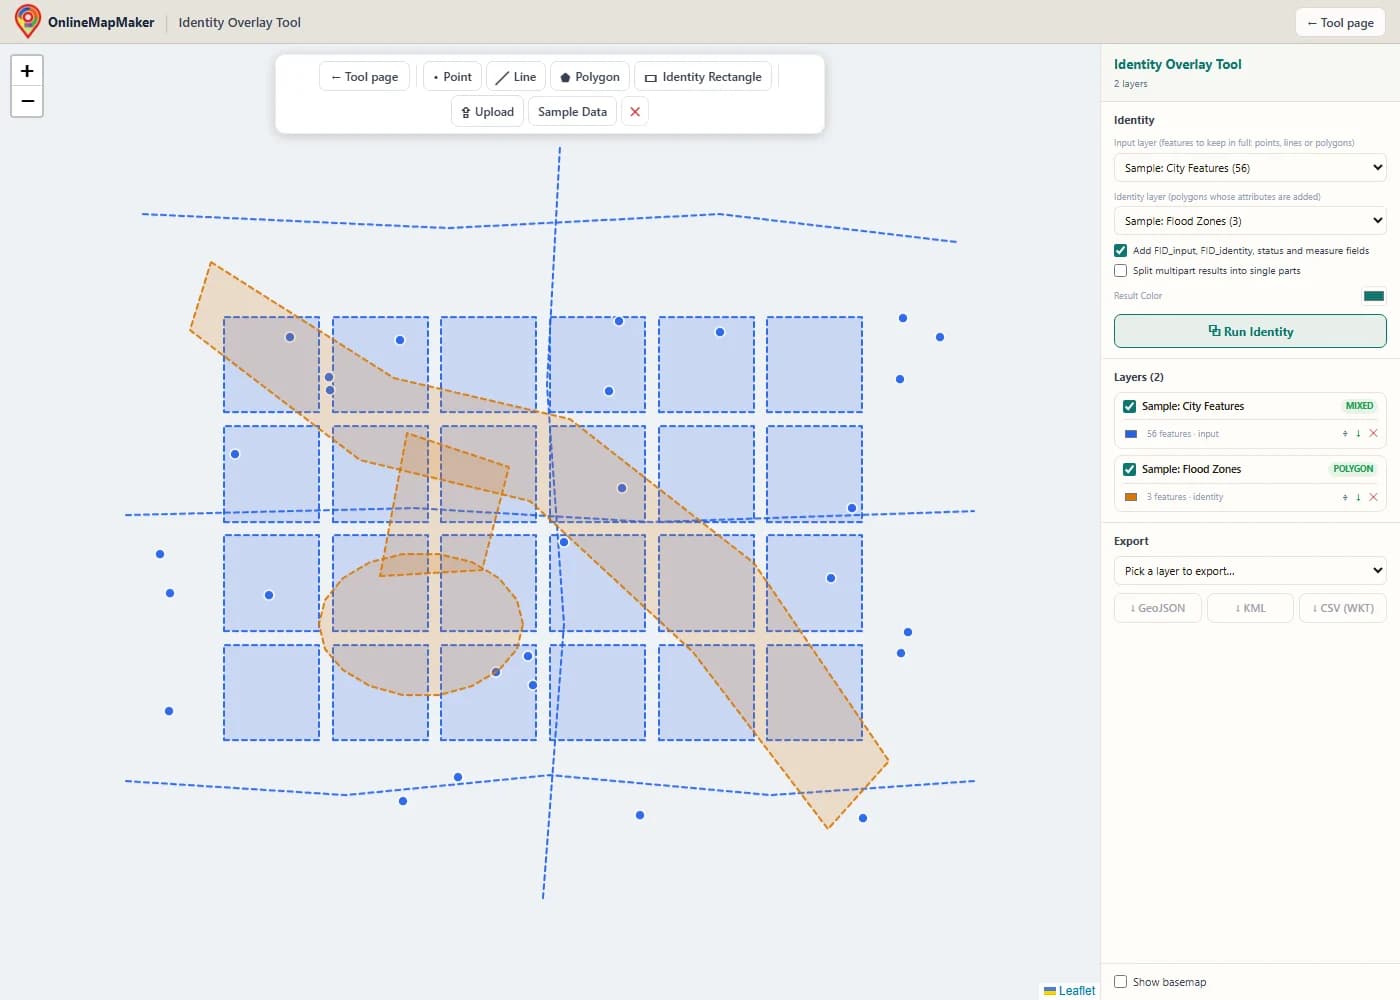
Drag and drop your files onto the map, or click Upload. Here I clicked Sample Data. It adds a city layer with parcels, roads and points, and a flood-zone layer with a floodway, a retention basin and a spillway that overlap each other.
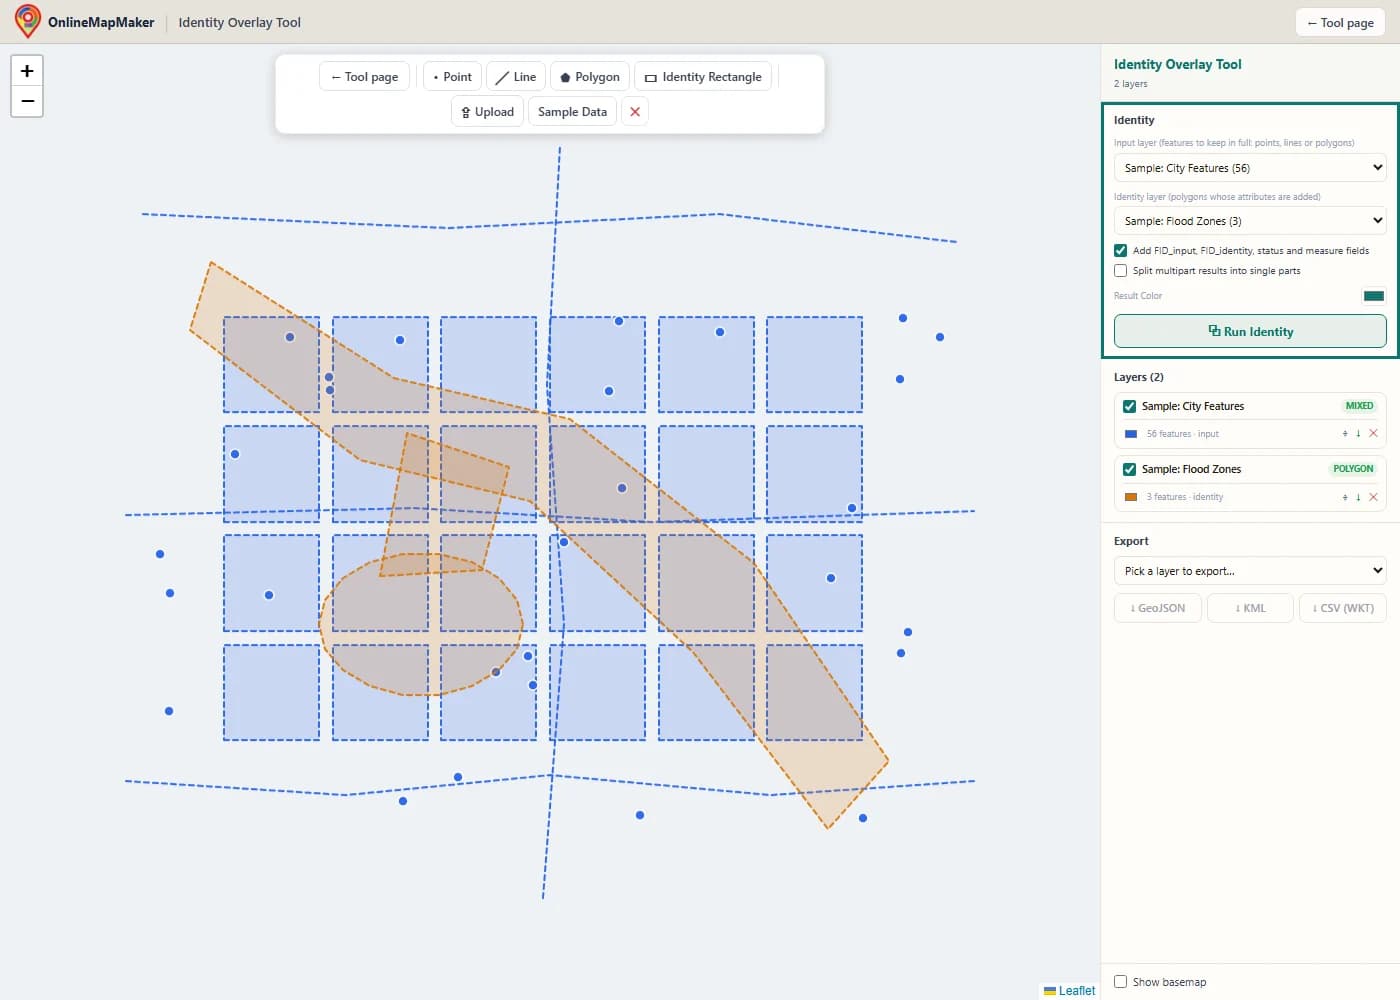
In the Identity panel, choose the input layer (the data to keep in full) and the identity layer (the polygons that give their attributes). Only layers with polygons appear in the identity list. Choose whether you want the tracking fields and whether multipart results should be split.
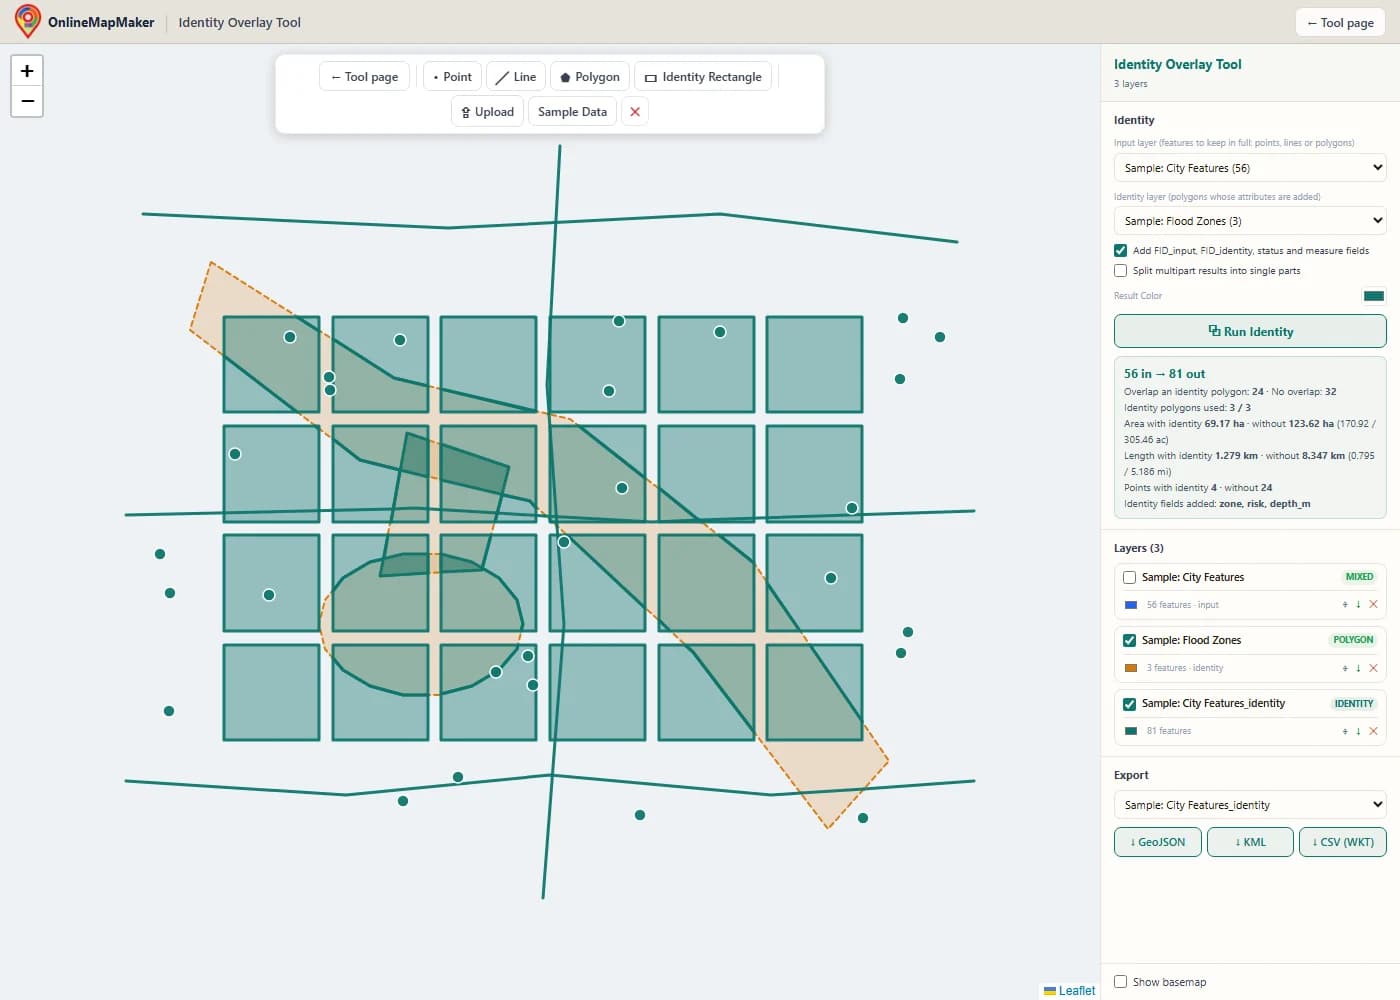
The result appears as a new layer, and the input layer is hidden. Every parcel, road and point is still there, but the parcels and roads are now cut along the zone borders. The results box shows how many input features overlap a zone, how many do not, and the area, length and points with and without identity attributes.
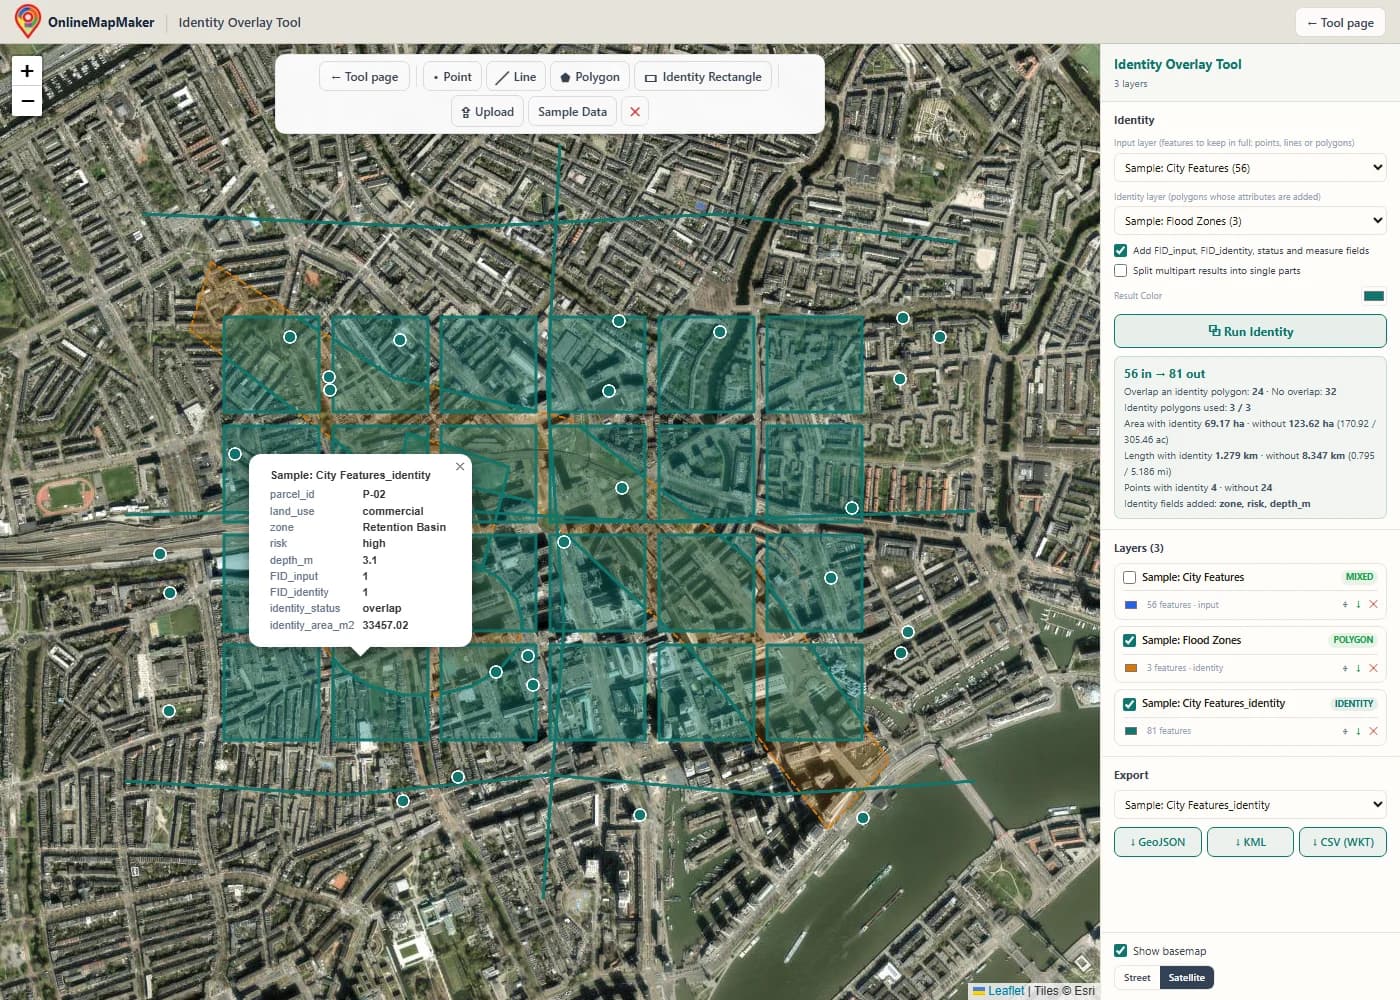
Tick "Show basemap" to see the result on a street or satellite map. Click a piece that sits inside a zone to open its attributes. You see the parcel fields and the zone fields in one table. A piece outside every zone shows empty zone fields.
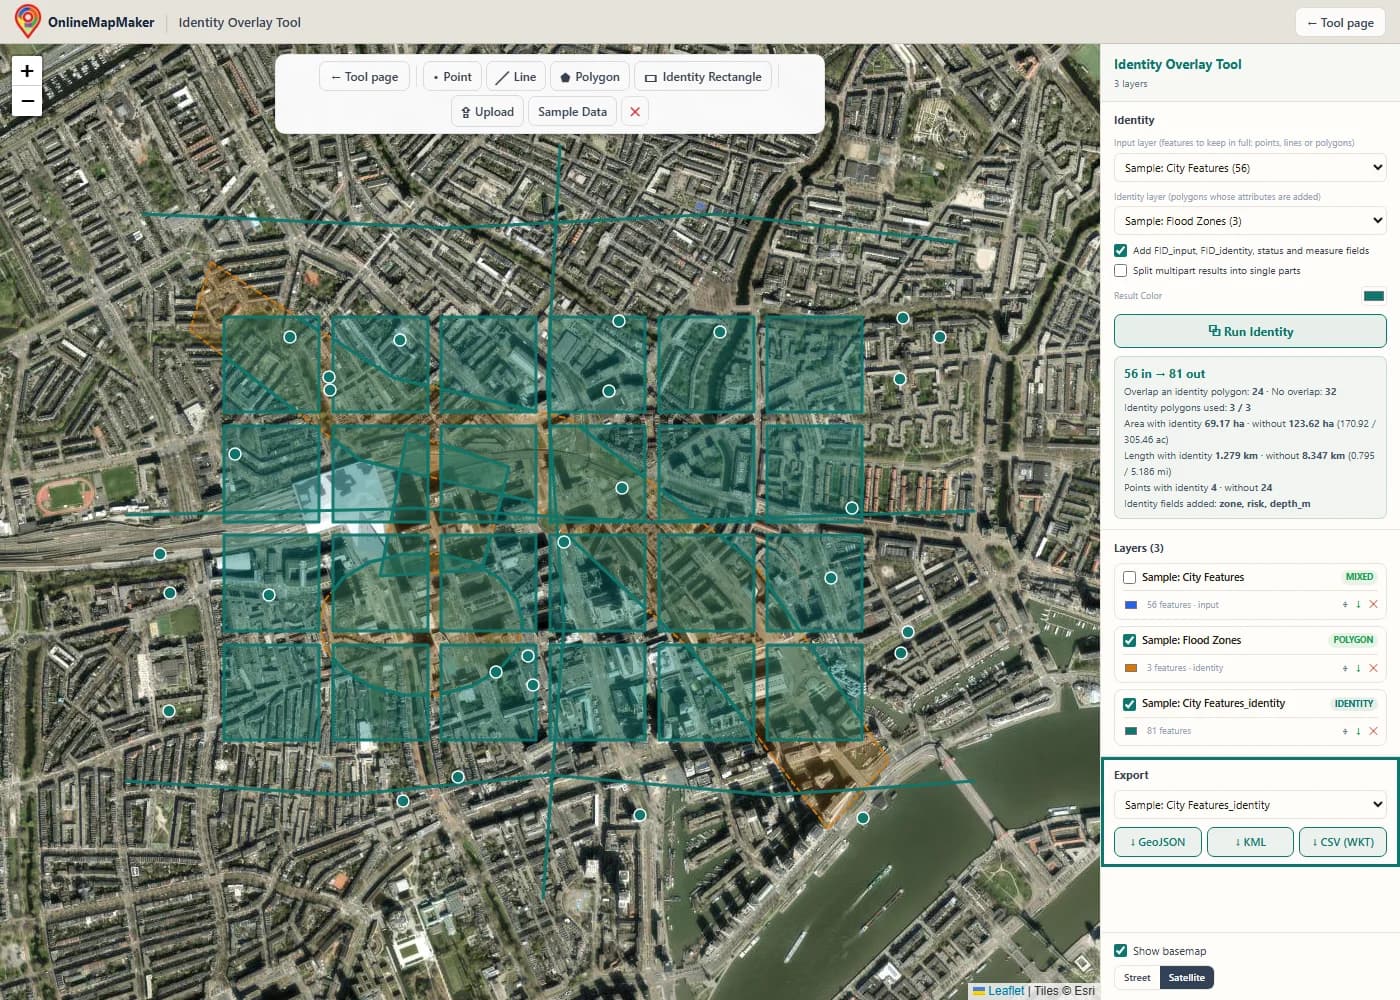
In the Export panel, pick the layer and download it as GeoJSON, KML or CSV with a WKT column. The small arrow next to each layer in the Layers panel is a quick GeoJSON download.
How to run an identity overlay in a GIS
Not every GIS has a tool with this name. ArcGIS calls it Identity, GeoPandas uses overlay with how="identity", and QGIS needs two tools. Here is how to do it in this tool, in ArcGIS Pro, in ArcMap and in QGIS, and how to script it.
In this tool
Load the layer you want to keep and the polygons that carry the attributes. Choose the first as the input layer and the second as the identity layer, then click Run Identity. Points, lines and polygons in the same input layer are all processed in one run. If you only need to tag features with a rectangular area, click Identity Rectangle and click two opposite corners on the map.
In ArcGIS Pro
Open the Geoprocessing pane and search for Identity. It is in the Analysis toolbox under Overlay. Set Input Features and Identity Features, choose an output, and pick the Join Attributes option: All gives you the FID fields and all attributes, Without FIDs leaves out the FID fields, and Only FIDs keeps only the IDs. Click Run. Check the tool page for the licence level your version needs.
In ArcMap
In ArcMap the tool is in ArcToolbox > Analysis Tools > Overlay > Identity, and it needs an Advanced (ArcInfo) licence. The parameters are the same as in ArcGIS Pro. Esri retired ArcMap in March 2026, so for new work I recommend ArcGIS Pro, QGIS or this tool. Old scripts that call Identity_analysis move to ArcGIS Pro with small changes.
In QGIS
QGIS has no tool called Identity, but you can build it in three steps. Run Vector > Geoprocessing Tools > Intersection (input layer and overlay layer) to get the overlap pieces with both attribute sets. Run Vector > Geoprocessing Tools > Difference to get the parts of the input that have no overlay. Then use Vector > Data Management Tools > Merge Vector Layers to join the two outputs. The Difference layer has no overlay fields, so they stay empty after the merge.
With arcpy (Python for ArcGIS)
In ArcGIS Pro the function is arcpy.analysis.Identity(in_features, identity_features, out_feature_class, join_attributes, cluster_tolerance, relationship). Old ArcMap scripts use arcpy.Identity_analysis. The code below shows this form, plus the same job in PyQGIS, GeoPandas and PostGIS.
The same identity overlay in code
If you tag the same layers every week, a script saves time. All these examples split a parcels layer by flood zones and keep the attributes of both.
import arcpy

arcpy.env.workspace = r"C:\data\city.gdb"

# ArcGIS Pro: Analysis toolbox > Overlay > Identity
# join_attributes: "ALL" (default), "NO_FID" or "ONLY_FID"
arcpy.analysis.Identity("parcels", "flood_zones", "parcels_zoned", "ALL")

# Older ArcMap syntax (same tool, old name)
arcpy.Identity_analysis("parcels", "flood_zones", "parcels_zoned")
# QGIS has no Identity tool: Intersection + Difference, then merge
inter = processing.run("native:intersection", {
"INPUT": "C:/data/parcels.shp",
"OVERLAY": "C:/data/flood_zones.shp",
"OUTPUT": "memory:",
})["OUTPUT"]
diff = processing.run("native:difference", {
"INPUT": "C:/data/parcels.shp",
"OVERLAY": "C:/data/flood_zones.shp",
"OUTPUT": "memory:",
})["OUTPUT"]
processing.run("native:mergevectorlayers", {
"LAYERS": [inter, diff],
"OUTPUT": "C:/data/parcels_zoned.gpkg",
})# GeoPandas
import geopandas as gpd
parcels = gpd.read_file("parcels.shp")
flood = gpd.read_file("flood_zones.shp").to_crs(parcels.crs)
parcels_zoned = gpd.overlay(parcels, flood, how="identity")
parcels_zoned.to_file("parcels_zoned.gpkg")
-- PostGIS
SELECT p.parcel_id, p.land_use, z.zone, z.risk, ST_Intersection(p.geom, z.geom) AS geom
FROM parcels p
JOIN flood_zones z ON ST_Intersects(p.geom, z.geom) AND NOT ST_Touches(p.geom, z.geom)
UNION ALL
SELECT parcel_id, land_use, NULL, NULL, geom FROM (
SELECT p.parcel_id, p.land_use,
ST_Difference(p.geom, COALESCE(
(SELECT ST_Union(z.geom) FROM flood_zones z WHERE ST_Intersects(p.geom, z.geom)),
ST_GeomFromText('POLYGON EMPTY', 4326))) AS geom
FROM parcels p
) rest
WHERE NOT ST_IsEmpty(geom);My take: for one overlay on a normal-sized file, this tool is the fastest way from file to result. In GeoPandas, overlay(how="identity") is the shortest script. In ArcGIS Pro, reach for the Identity tool and keep the FID fields on, because they make it easy to trace each piece back to its source.
How the tool works, step by step
This is the path your data takes from the moment you click Run Identity. Every step runs in your browser.
- Read and clean the input. Every file is turned into GeoJSON features in WGS84. A GeometryCollection is split into separate features with the same attributes, so the engine only sees simple geometry types.
- Prepare the identity polygons. Each identity polygon is kept as its own feature with its own attributes and its own bounding box. Nothing is merged or dissolved. The tool also reads the attribute names of both layers and decides the output field names, renaming any identity field that clashes with an input field.
- Find the nearby identity polygons. For each input feature, the tool compares its bounding box with the bounding box of every identity polygon. Only the polygons whose boxes touch are used for the detailed math. An input feature with no such polygon is copied to the output at once with empty identity fields.
- Cut points. Each point is tested with a point-in-polygon test against every nearby identity polygon. A point inside a polygon (or on its edge) becomes one output point for that polygon, with its attributes. A point inside no polygon is kept with empty identity fields.
- Cut lines. Each line segment is tested against the edges of each nearby polygon. The tool finds every place where the segment crosses an edge, cuts it there, and tests the middle of each small piece. Pieces inside a polygon go to that polygon. Pieces outside all nearby polygons are chained back into lines and kept with empty identity fields.
- Cut polygons. Each input polygon is intersected with each nearby identity polygon with a sweep-line boolean operation (Martinez-Rueda). Each non-empty result is an overlap piece with that polygon's attributes. Then the input polygon minus all nearby identity polygons gives the remaining piece with empty identity fields.
- Copy attributes and add fields. Each output feature gets a copy of all attributes from its input feature, then the identity fields (real values or null), then the optional tracking fields. If you ticked the multipart option, multipart results are split into single parts here.
- Report and draw. The tool counts matched and unmatched input features, adds up the area, length and points with and without identity attributes, lists the new fields, and draws the result as a new layer. The input layer is hidden so you can see the result clearly.
The code for lines is shared with the Clip and Erase tools on this site. Clip keeps the pieces whose middle is inside the mask, Erase keeps the pieces whose middle is outside, and Identity does both, one pass per identity polygon plus one pass for the rest.
The theory and math behind the identity overlay
Identity is built from two basic set operations on geometry. Here is the math, from the set rule to the algorithms, the history and the measurements.
1. Identity as intersection plus difference
Let A be the input layer and B the identity layer, with polygons B1 to Bk. Each input feature a is replaced by its overlap with every Bj, plus the part of a that is outside all of them. The attributes of a go on every piece. The attributes of Bj go only on the piece a ∩ Bj.
Identity(A, B) = Intersect(A, B)  ∪  Erase(A, B)

for each a in A:
  overlap pieces   a ∩ Bj        (one per Bj with a ∩ Bj ≠ ∅)   fields: a + Bj
  remaining piece  a ∖ (B1 ∪ … ∪ Bk)   (if not empty)           fields: a + null
The set of pieces always covers a completely. If the identity polygons do not overlap each other, the pieces do not overlap either, and they add up to exactly a.
2. A worked example
Take a parcel P from x = 2 to 10 and y = 0 to 5 (area 40). Zone Z1 covers x = 0 to 6 and Z2 covers x = 4 to 8, both from y = 0 to 10, and the two zones overlap between x = 4 and 6. The tool makes three output features.
Piece              Shape            Area   Fields
P ∩ Z1             x 2–6, y 0–5     20     P + Z1 (zone A)
P ∩ Z2             x 4–8, y 0–5     20     P + Z2 (zone B)
P ∖ (Z1 ∪ Z2)      x 8–10, y 0–5    10     P + null

Sum of pieces = 20 + 20 + 10 = 50
Area of P     = 40
Difference    = 10 = area of P ∩ Z1 ∩ Z2  (x 4–6, y 0–5, counted twice)
This is the case to remember. When identity polygons overlap, the input area appears once per polygon, so the pieces add up to more than the input. If you need pieces that add up exactly, dissolve or clean the identity layer first, so its polygons do not overlap.
3. The attribute table of the output
The output fields are the input fields, then the identity fields, then the tracking fields. Every output feature has the same set of fields, which makes the layer safe to open in a Shapefile or a database. A field that does not apply is null, not missing.
Fields = input fields  +  identity fields  +  tracking fields

Name clash rule:   name → name_1 → name_2 …  (input names win)

Tracking fields (optional)
  FID_input        index of the input feature (0, 1, 2 …)
  FID_identity     index of the identity polygon, or -1 for "none"
  identity_status  overlap  |  input_only
The FID_identity value of -1 for "no identity polygon" is the same rule ArcGIS uses. It lets you filter the two kinds of piece with one test.
4. Point in polygon: the ray casting rule
To decide if a point is inside an identity polygon, draw a ray from the point to the right and count how many times it crosses the polygon boundary. An odd count means inside, an even count means outside. Holes need no special case: their edges are counted like any other edge, which is why a point in a hole gets no attributes from that polygon.
Point P = (x, y). Edge from (xi, yi) to (xj, yj).

The edge is crossed when:
  (yi > y) ≠ (yj > y)
  and  x < xi + (y − yi) · (xj − xi) / (yj − yi)

P is inside  ⇔  the number of crossed edges is odd
Identity gives P the polygon's attributes  ⇔  P is inside or on an edge
5. Polygon intersection and difference with a sweep line
Polygon boolean operations have a long history in computer graphics. Sutherland and Hodgman (1974) could clip against a convex window. Weiler and Atherton (1977) handled concave shapes and holes. Vatti (1992) and Greiner and Hormann (1998) made the general case practical. GIS data needs that general case: any shape, with holes, many parts and edges that touch.
This tool uses polyclip-ts through Turf.js. It is based on the sweep-line algorithm of Martínez, Rueda and Feito (2009). An imaginary vertical line moves from left to right across both polygons and stops only at vertices and crossing points. At each stop, every edge is labelled as inside or outside the other polygon. For an intersection the result keeps the edges that are inside the other polygon, and for a difference it keeps the edges that are outside. With n edges and k crossings the cost is about O((n + k) · log n).
6. Where the name comes from
The name is older than the web. ARC/INFO, the first big commercial vector GIS, had a set of overlay commands: CLIP, ERASE, IDENTITY, INTERSECT, UNION and UPDATE. ArcGIS kept the names. Overlay as a method goes back further, to the Canada Geographic Information System of the 1960s, and to the hand-drawn map overlays on clear film that planners used before computers, which Ian McHarg made famous in "Design with Nature" (1969).
The film comparison still helps. Identity is like laying the zone map on top of your parcel map, drawing the zone borders onto the parcels, and then writing the zone name on every piece.
7. Measuring the results
The results panel reports areas and lengths on the Earth's surface, not in degrees. Areas use the spherical ring formula from Chamberlain and Duquette (NASA JPL, 2007), which Turf.js uses. Lengths use the haversine formula. Both use the mean Earth radius R = 6,371,008.8 m.
Ring area (λ = longitude, φ = latitude, in radians):
A = (R² / 2) · | Σ (λ(i+1) − λ(i−1)) · sin φi |

Segment length (haversine):
h = sin²(Δφ / 2) + cos φ1 · cos φ2 · sin²(Δλ / 2)
d = 2R · asin(√h)

R = 6 371 008.8 m
A sphere is a close model of the Earth. For areas and lengths, the error is usually under 1 percent. That is fine for planning and for checking a result. For legal or survey-grade numbers, measure again in a local projected coordinate system.
Identity in this tool, ArcGIS Pro and QGIS compared
All three give the same pieces for normal data. They differ in cost, set-up and how much data they can handle. Here is a side-by-side view.
| Feature | This tool | ArcGIS Pro | QGIS |
|---|---|---|---|
| Name of the tool | Identity Overlay | Identity | No single tool: Intersection + Difference + Merge |
| Price | Free, no account | Paid ArcGIS licence | Free and open source |
| Installation | None, runs in the browser | Windows desktop app | Desktop app for Windows, macOS and Linux |
| Input formats | GeoJSON, Shapefile ZIP, KML, KMZ, GPX, WKT | Geodatabases, shapefiles and many more | Everything GDAL/OGR can read |
| Handles points, lines and polygons | Yes, even mixed in one layer | Yes, one geometry type per layer | Yes, one geometry type per layer |
| Attributes in output | Input and identity fields, optional tracking fields | Input and identity fields, FID fields by option | Input and overlay fields from Intersection, empty from Difference |
| Automation | None, one run at a time | arcpy and ModelBuilder | PyQGIS and the Graphical Modeler |
| Very large datasets | Up to 50 MB per file | Yes | Yes |
| Where your data goes | Stays in your browser | Stays on your computer | Stays on your computer |
My recommendation: if your data lives in an ArcGIS geodatabase, use the Identity tool in ArcGIS Pro. It is built for this, and arcpy lets you repeat the job. If you want a full desktop GIS at no cost, QGIS can do it with the two-step recipe above, and GeoPandas does it in one line.
This tool wins when you need a result in a minute: someone sends you a zipped Shapefile of parcels and a KML of zones, and you need the parcels split by zone with both attribute tables. You do not have to install anything, and nothing leaves your computer. It is also a clear way to learn how Identity behaves, because you see every cut on the map.
10 real-world use cases
Identity answers the question "which zone, district or class does each part of my feature fall in?" without losing any of the feature. These are the jobs I see most often.
- Parcels split by flood zone. A planner overlays parcels with flood zones. Each parcel is cut along the zone border, and every piece knows its zone and flood depth. Parcels outside all zones stay in the layer with empty zone fields, so the count of parcels never drops.
- Land use and zoning. A city overlays its land-use polygons with zoning districts to find where the actual use differs from the zoning. Each piece carries both fields, so one filter shows the mismatches.
- Roads by municipality. A road authority cuts a national road layer by municipal boundaries. Each road piece gets the municipality name, and the pieces can be summed to give kilometres of road per municipality.
- Habitat by protection status. An ecologist overlays a habitat map with protected areas. The result shows, for every habitat patch, which part is protected and under which designation, and which part is not.
- Wells and facilities by watershed. A hydrologist tags every well point with the watershed it falls in. Points inside no watershed are kept with empty fields, which also finds points with wrong coordinates.
- Soil and farm fields. An agronomist overlays field boundaries with soil map units. Each field splits into one piece per soil type, and the area per soil type becomes a column to use in a fertiliser plan.
- Customers by service area. A utility overlays customer points with its service areas. Every customer keeps its record and gains the area code and the operator, and customers outside any area show up as empty.
- Tracks by region. A hiker or researcher overlays a GPX track with region polygons. The track is cut at each border, and each piece carries the region name, so the length per region is one sum away.
- Census data for custom areas. A market analyst overlays store catchments with census tracts. The pieces carry the tract fields, and area shares can be used to weight the numbers.
- Teaching overlay analysis. Teachers show Intersect, Erase and Identity side by side with the same sample data. Students see that Identity is the first two put together, which makes the set rule easy to remember.
Frequently asked questions
Direct answers to the questions people ask about the identity overlay in GIS.
1. What does the Identity tool do in GIS?
Identity keeps every feature of the input layer and splits it where it overlaps the polygons of an identity layer. The pieces inside a polygon get that polygon's attributes added. The pieces outside all polygons stay in the output with empty values in the identity fields. The output covers the whole input.
2. What is the difference between Identity and Union?
Union keeps everything from both layers, including the identity polygons that touch no input feature. Identity keeps only the extent of the input layer. If your input is the layer that matters and the second layer only tags it, use Identity. If both layers matter equally, use Union.
3. What is the difference between Identity and Intersect?
Intersect keeps only the part where the two layers overlap and drops the rest. Identity keeps that part too, and also keeps the input outside the overlap. Identity is Intersect plus Erase.
4. What is the difference between Identity and a spatial join?
A spatial join leaves the geometry of the input unchanged and copies attributes from one matching feature. Identity cuts the geometry along the identity borders, so each piece gets the correct attributes. Use a spatial join when features must stay whole, and Identity when you need to know which part is in which zone.
5. Does QGIS have an Identity tool?
Not under that name. In QGIS you run Intersection and Difference with the same two layers, and merge the outputs with Merge Vector Layers. The result matches Identity. In GeoPandas the same job is overlay(df1, df2, how="identity").
6. Which attributes does the output keep?
Every attribute of the input feature is copied to every piece. The attributes of the identity polygon are added as new fields. Pieces outside all identity polygons have null values in those fields. As an option, the tool adds FID_input, FID_identity, identity_status and the area, length or number of points of each piece.
7. What happens when an identity field has the same name as an input field?
The input field keeps its name and the identity field gets a suffix, for example name and name_1. This is the same rule ArcGIS uses. The results box lists each renamed field, so you can see what changed.
8. Why does my output have more features than my input?
Features are cut where they cross an identity border, so one input feature can become several output pieces. If your identity polygons overlap each other, the overlap also appears once per polygon. Tick "Add FID_input" fields and group by FID_input to see which pieces came from the same feature.
9. Can I use lines and points, or only polygons?
You can use all three as the input. Lines are cut at the identity borders, and points get the attributes of the polygon that holds them. The identity layer must have polygons, because only a polygon can give an area to overlay.
10. What happens to features exactly on an identity border?
The edge counts as inside. A point exactly on the edge gets that polygon's attributes, and so does a line piece that runs along the edge. A polygon that only touches the border from outside is not cut. A point on a border shared by two identity polygons becomes two output points, one for each polygon.
11. Why do the areas of my pieces add up to more than the input?
This happens when identity polygons overlap each other. The input area in the overlap is counted once per polygon. Clean or dissolve the identity layer first if you need the pieces to add up exactly. The worked example on this page shows the numbers.
12. Which file formats can I upload and download?
You can upload GeoJSON, a zipped Esri Shapefile (with .shp, .shx and .dbf, plus .prj for projected data), KML, KMZ, GPX and WKT. You can download GeoJSON, KML and CSV with a WKT geometry column. GeoJSON is the best choice for ArcGIS Pro or QGIS, because it keeps the attribute types.
13. Is my data uploaded to a server?
No. Reading the files, the overlay and writing the output all run in your browser. Your files never leave your computer. Only the optional basemap tiles come from the internet, and only after you turn the basemap on.
14. Can I use projected data, such as UTM?
The tool works in WGS84 longitude and latitude (EPSG:4326). A zipped Shapefile in UTM or a national grid is converted to WGS84 when it loads, as long as its .prj file is inside the ZIP. GeoJSON should already be in WGS84, as the GeoJSON standard requires.
15. No feature got identity attributes. What went wrong?
The most common cause is that the two layers do not overlap. Turn on the basemap and zoom to each layer to check where they are. A Shapefile without its .prj file often lands in the wrong place. Also check that you picked the polygon layer as the identity layer, not as the input.
16. How do I run Identity with arcpy or GeoPandas?
In ArcGIS Pro, call arcpy.analysis.Identity("parcels", "flood_zones", "parcels_zoned"). In GeoPandas, call geopandas.overlay(parcels, flood, how="identity"). Both are shown with full code on this page. A for loop over several layers is where scripting saves the most time.
17. Are the area and length numbers accurate?
They are measured on a sphere with a radius of 6,371,008.8 m, so they are in real square metres and metres, not degrees. The error against the true ellipsoid is usually under 1 percent. For legal or survey-grade values, measure again in a local projected coordinate system.
Libraries used and credits
This tool is built on open source software. Many thanks to the people who write and maintain these projects.
- Leaflet 1.9 · BSD-2-Clause · Volodymyr Agafonkin and contributorsDraws the interactive map, the layers, the drawing tools and the popups.
- Turf.js 7 (@turf/intersect, @turf/difference, @turf/area, @turf/boolean-point-in-polygon) · MIT · Turf authorsPolygon intersection and difference for the overlay, geodesic area, and the point-in-polygon test.
- polyclip-ts · MIT · Luiz Felipe Machado Barboza, based on polygon-clipping by Mike FogelThe boolean polygon engine behind Turf's intersect and difference. It uses the Martinez-Rueda sweep-line algorithm with arbitrary-precision math.
- point-in-polygon-hao · MIT · Rowan WinsemiusThe fast point-in-polygon test that decides which points and line pieces fall inside each identity polygon.
- shpjs · MIT · Calvin MetcalfReads zipped Esri Shapefiles (.shp, .shx, .dbf, .prj, .cpg) in the browser.
- proj4js · MIT · proj4js contributorsConverts projected Shapefiles to WGS84 using their .prj file (used by shpjs).
- @tmcw/togeojson · BSD-2-Clause · Tom MacWrightConverts KML and GPX files to GeoJSON.
- JSZip · MIT or GPL-3.0 · Stuart KnightleyOpens KMZ archives to read the KML file inside.
- @terraformer/wkt · MIT · Terraformer contributorsReads WKT input and writes the WKT geometry column in the CSV export.
- OpenStreetMap, Protomaps (hosted by KONAKTIVE), CARTO, Esri World Imagery · ODbL and provider terms · OpenStreetMap contributors, Protomaps, KONAKTIVE, CARTO, EsriBasemap tiles and imagery, shown only when you turn the basemap on.
The line cutting step (splitting segments at boundary crossings and testing each piece) was written for this site and is shared with the Clip and Erase tools. The identity engine is checked with automated tests for polygons that cross one or two zones, lines through holes, points inside two overlapping zones and on borders, clashing field names, and the rule that the overlap pieces plus the remaining pieces cover the whole input.
Related geoprocessing tools
All overlay work runs in your browser. No file is ever uploaded to a server. Map tiles © OpenStreetMap contributors, drawn with Protomaps (hosted by KONAKTIVE), with CARTO as the fallback. Satellite imagery: Esri.