View your SHP files as interactive maps right from your browser. Upload a ZIP file containing your Esri shapefile and view the GIS features on an interactive map — instantly, with no software required. Inspect attributes, change colours, switch basemaps, and export to GeoJSON.
How to Open a Shapefile — The Fastest Way, Without Desktop GIS Software
The Esri shapefile has been the dominant vector GIS format for over thirty years. Government agencies, environmental organisations, urban planners, and GIS professionals around the world store and exchange spatial data in shapefiles every day. But opening one has traditionally required installing QGIS, ArcGIS, or another desktop GIS application — which takes time, storage space, and at least a basic understanding of GIS workflows.
This online shapefile viewer removes that barrier entirely. Compress your shapefile's companion files into a single ZIP archive, drop it into the upload zone, and your vector features appear on an interactive map within seconds. You can inspect the attribute data behind every polygon, line or point by clicking on it, change the feature colour to suit your presentation, overlay the data on satellite imagery or topographic maps, and export the entire dataset as GeoJSON for use in web applications — all without leaving your browser. In short: view your SHP files as interactive maps right from your browser, with nothing to install.
Watch: Online Shapefile Viewer in Under a Minute
Prefer to watch instead of read? This short walkthrough covers uploading a Shapefile and viewing its features and attributes on the map.
Inspecting Attribute Data Without a GIS Application
One of the most valuable things you can do with a shapefile beyond simply seeing its geometry is understanding the data behind it. The .dbf attribute table can contain dozens of columns — country names, census figures, land-use codes, infrastructure IDs, population statistics, elevation values, or any other tabular information that a GIS analyst attached to the spatial features.
In this viewer, every feature on the map is clickable. Clicking a polygon, line, or point opens a popup listing all the attribute fields and their values for that specific feature. You can see at a glance what a particular zone is classified as, what the population of a district is, or what the name of a road is — without exporting to Excel or opening a separate database viewer. This is what makes it possible to view shapefiles online and still get real answers from the data, not just a picture.
What Is a Shapefile and What Files Does It Contain?
Despite the name, a shapefile is never a single file. Every shapefile is a collection of companion files that share the same base name and must always travel together. The core mandatory files are:
- .shp — the geometry file, containing the raw coordinate data for each feature (the actual points, lines, or polygon rings).
- .dbf — the dBase attribute table, which stores the non-spatial data associated with each feature: names, codes, measurements, categories, or any other tabular information.
- .shx — the shape index, a small file that helps software quickly skip to a specific record in the .shp file.
- .prj — the coordinate reference system definition in WKT format, telling software how to place the coordinates on the surface of the Earth. Without this, your data may appear in the wrong location on the map.
To use this viewer, put all these files together in a single .zip archive (without subfolders) and upload the ZIP. The viewer parses the binary shapefile format in your browser using the shpjs library, reprojects the coordinates to WGS 84, and renders the features as a Leaflet map layer. This is the fastest way to open shapefile online data without installing anything — think of it as a shp reader online that needs nothing installed.
Frequently Asked Questions
Can I use this to view very large shapefiles?
Yes, but with limitations. This tool runs entirely in your browser, which means large files rely on your computer's RAM and CPU. Files up to about 20–30 MB generally work smoothly. Files between 30–100 MB will load but may take several seconds and can make the browser temporarily unresponsive. Files over 100 MB may exceed browser memory limits and cause the page to crash or hang. For large datasets, we recommend simplifying the geometry first using QGIS's Simplify tool (Vector > Geometry Tools > Simplify), or clipping the data to your area of interest before uploading.
Why isn't my shapefile loading?
The most common causes are: (1) The ZIP contains subfolders — the .shp and .dbf must be at the root level of the archive. Re-zip with the files directly. (2) The .dbf file is missing — some export tools omit it if there are no attributes. Add an empty .dbf or use QGIS to re-export. (3) The shapefile uses a non-standard encoding in the .dbf — try adding a .cpg file with the encoding name (e.g., UTF-8). (4) The .shp file is corrupt — open it in QGIS and re-save as a standard Esri shapefile. (5) The file is very large (over 100 MB) — very large shapefiles may cause the browser to run out of memory. Simplify or clip the data first using QGIS.
What does the Download GeoJSON button do?
Clicking Download GeoJSON exports all the features from your uploaded shapefile as a GeoJSON file (.geojson). GeoJSON is an open, web-friendly format that is natively supported by JavaScript mapping libraries, QGIS, ArcGIS Online, GitHub (which renders GeoJSON maps automatically), and most modern GIS tools. The exported file contains the exact same features and attribute data as your original shapefile, reprojected to WGS 84. This makes the tool a quick shapefile-to-GeoJSON converter without needing to install any software.
Can I view multiple shapefiles at the same time?
Currently the viewer loads one shapefile at a time — loading a new file replaces the previous layer on the map. If your ZIP contains multiple shapefiles (multiple .shp files with different base names), all of them are merged and displayed as a single layer. To compare multiple shapefiles simultaneously, consider using QGIS (free, open-source) which supports unlimited layers, or convert each shapefile to GeoJSON using this tool's export feature and then combine them in a web mapping library like Leaflet or Mapbox GL JS.
How do I get a shapefile from OpenStreetMap data?
There are several ways to export OpenStreetMap data as a shapefile. Overpass Turbo (overpass-turbo.eu) lets you query OSM data with a filter (e.g. all roads in a city) and export as GeoJSON, which you can then convert to a shapefile using QGIS. Geofabrik (download.geofabrik.de) provides pre-made regional extracts of OSM data in shapefile format for free download by country or region — these are ready to drag into this viewer. The Humanitarian OpenStreetMap Team (HOT) also provides shapefile exports for many countries at data.humdata.org.
What coordinate reference systems (CRS) are supported?
This viewer reprojects all shapefile data to WGS 84 (EPSG:4326) on the fly, which is the geographic coordinate system used by web maps. If your shapefile includes a .prj file, the viewer will read the projection definition and reproject the coordinates automatically. Common CRS like UTM zones, State Plane, national grids (British National Grid, RD New, GDA94 etc.) and most EPSG-registered projections are supported. If your shapefile lacks a .prj file, the viewer assumes WGS 84 and the data may appear in the wrong location. In that case, open the file in QGIS, set the correct CRS, and re-export with a .prj file included.
What types of geometry does the viewer support?
The viewer supports all standard Esri shapefile geometry types: Point and MultiPoint (shown as circle markers on the map), PolyLine and Polyline (shown as lines), and Polygon and MultiPatch (shown as filled polygons). The Z (3D) and M (measure) variants of these types are also handled — the Z values are available in the attribute popup if present, though the map view is always 2D. Null geometry features (features in the .dbf with no corresponding shape) are silently skipped. The viewer does not support raster formats like GeoTIFF or ECW — those are not shapefiles.
Does my shapefile data get sent to a server?
No. Your shapefile is parsed entirely inside your browser using the FileReader API to read the ZIP, and the shpjs JavaScript library to parse the shapefile format. The raw file bytes never leave your computer — they are not uploaded to OnlineMapMaker's servers or any third-party service. The map tile images are fetched from tile servers like CARTO, OpenTopoMap, and Esri by sending only tile coordinates — not any of your GIS data. This makes the tool safe to use with confidential, proprietary, or sensitive GIS datasets.
What is a shapefile and which files do I need in the ZIP?
A shapefile is Esri's widely adopted format for storing vector GIS data — points, lines, or polygons with associated attribute data. It is not a single file but a collection of files that must share the same base name. The mandatory files are: .shp (the geometry), .dbf (the attribute table), and .shx (the shape index). Strongly recommended is .prj (the coordinate reference system / projection definition). Optional files include .cpg (character encoding for .dbf), .sbn and .sbx (spatial indices for fast queries). To use this viewer, compress all these companion files together into a single .zip archive — no subfolders — then upload that ZIP. If any mandatory file is missing the upload will fail. This shapefile viewer online handles all the required companion files automatically once uploaded.
What is the difference between a shapefile and GeoJSON?
Both formats store vector GIS data (points, lines, polygons) with attributes, but they have very different designs. A shapefile is Esri's binary format from the early 1990s — it splits data across multiple companion files (.shp, .dbf, .shx, .prj) and requires specialised software or libraries to read. GeoJSON is an open JSON-based standard from 2015 that is human-readable in any text editor, self-contained in a single file, and natively supported by every modern web browser and mapping library. GeoJSON is lighter and easier to use for web applications, while shapefiles remain common in enterprise GIS workflows and government data portals.
Common Use Cases
🏛️
Administrative Boundaries
View country, state, province, or municipal boundary shapefiles on a map. Change colours to distinguish regions, click to inspect names and codes from the .dbf, and export as GeoJSON for web map integration.
🌊
Environmental & Natural Features
Visualise watershed catchments, land cover zones, protected areas, soil types, geological units, or flood zones on top of basemap imagery to understand spatial patterns.
📋
Report & Presentation Maps
Load your project shapefile, pick a matching colour scheme, switch to the basemap that best tells your story, then screenshot the result for a report, slide deck, or stakeholder presentation.
🌍
Quick GIS Data Check
Wondering how to open a shapefile from a colleague or government data portal? Use this free online shapefile viewer to quickly verify its extent, geometry type, attribute fields, and coordinate system before opening it in desktop GIS software.
🏗️
Infrastructure Planning
Overlay utility networks, transport corridors, land parcels, or zoning boundaries on satellite imagery. Identify routing conflicts, coverage gaps, or site suitability without leaving the browser.
📊
Shapefile to GeoJSON Conversion
Use the Download GeoJSON button to instantly convert any Esri shapefile to GeoJSON format — ready for Mapbox, Leaflet, deck.gl, GitHub, or any modern web mapping tool.
Step-by-Step Guide
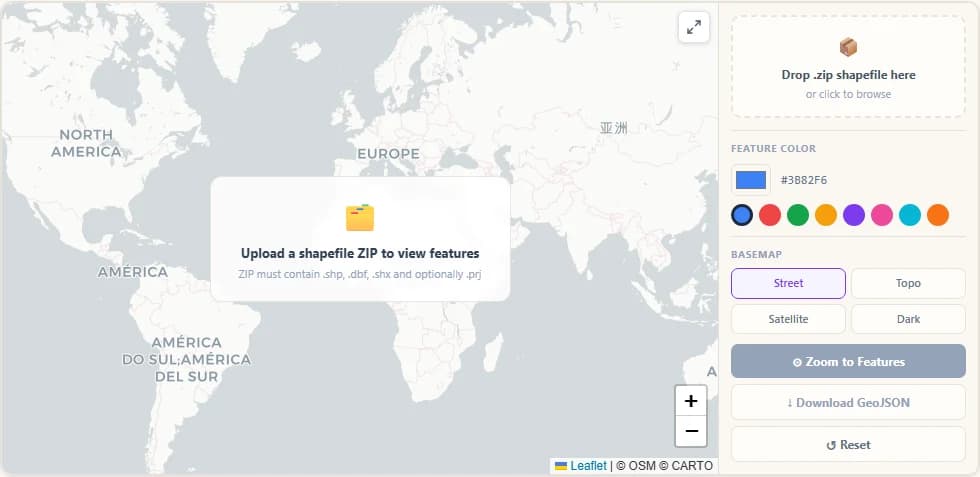
Step 1
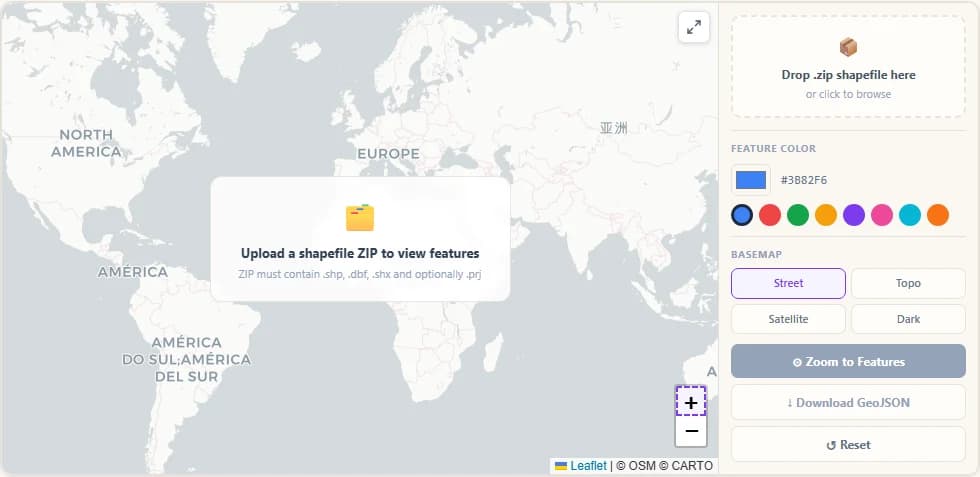
Tool Opens with Empty World Map
The Shapefile Viewer loads showing a clean world map with the sidebar on the right. The sidebar contains the file upload zone, layer info panel, colour picker, basemap selector, and action buttons.
Step 2
Drop Zone Ready for ZIP Upload
Drag your shapefile ZIP directly onto the dashed drop zone or click anywhere on it to open the file browser. The ZIP must contain at minimum the .shp and .dbf files — the .shx and .prj files are recommended but optional. This shapefile upload web viewer accepts drag-and-drop or manual file selection.
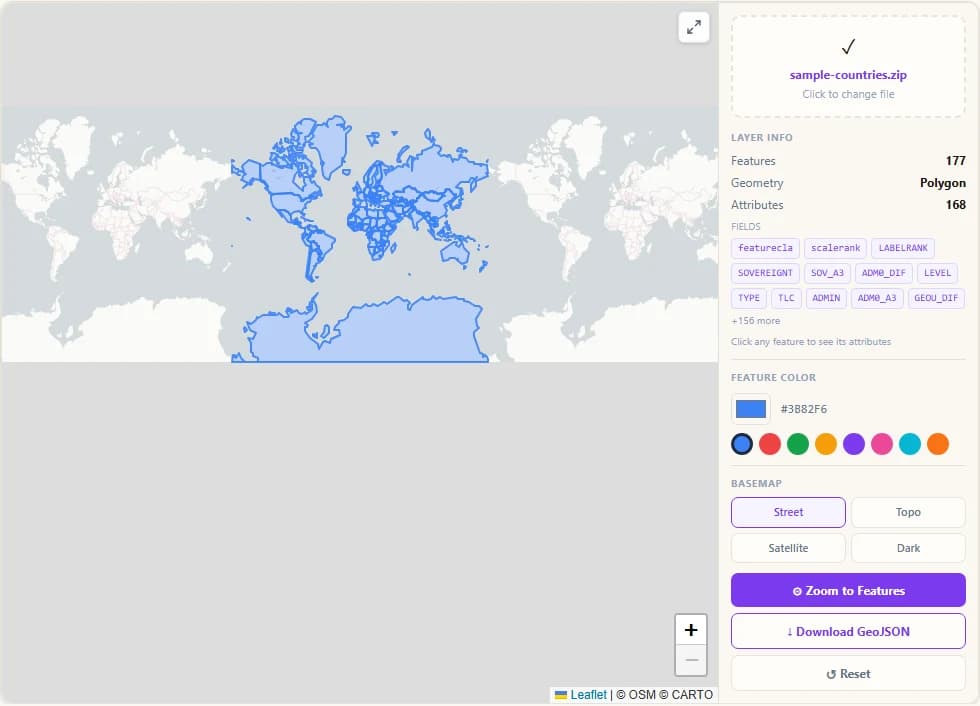
Step 3
Shapefile Features Appear on Map
After processing, your shapefile features appear as an overlay on the map. The sidebar shows the layer info: number of features, geometry type (Point, LineString or Polygon), and the list of attribute field names from the .dbf file.

Step 4
Change Feature Colour with Picker
Click the colour swatch or choose from the preset palette to instantly restyle all features. Both the fill and stroke colours update in real time. Choose a colour that contrasts well with your chosen basemap.
Step 5
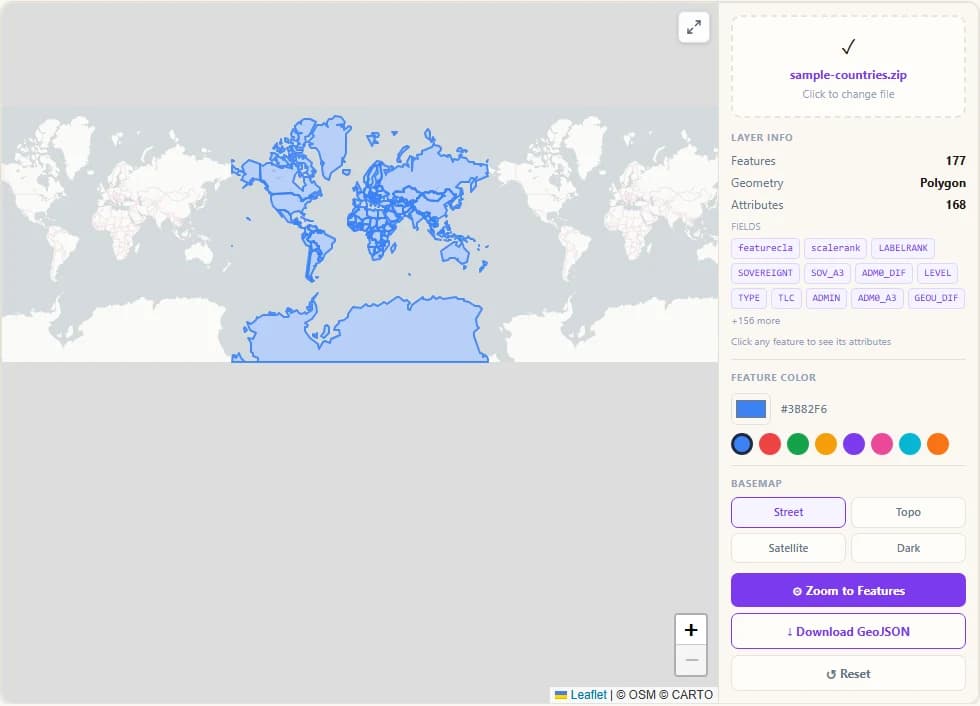
Click Feature to See Attributes
Click any feature on the map to open a popup listing all its .dbf attribute values — field name on the left, value on the right. This lets you inspect the data behind each polygon, line or point without needing desktop GIS software.
Step 6
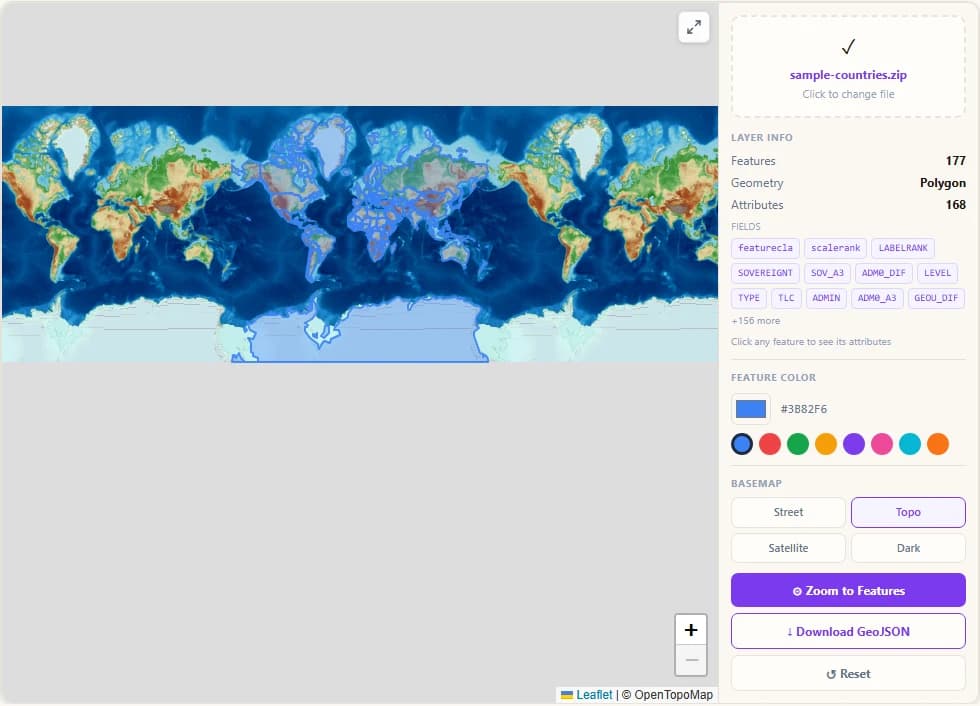
Topo Basemap Shows Terrain Context
Switch to the Topo basemap to see contour lines and terrain shading behind your shapefile data. Useful for elevation-related datasets like watersheds, land cover zones, or administrative boundaries in mountainous regions.
Step 7
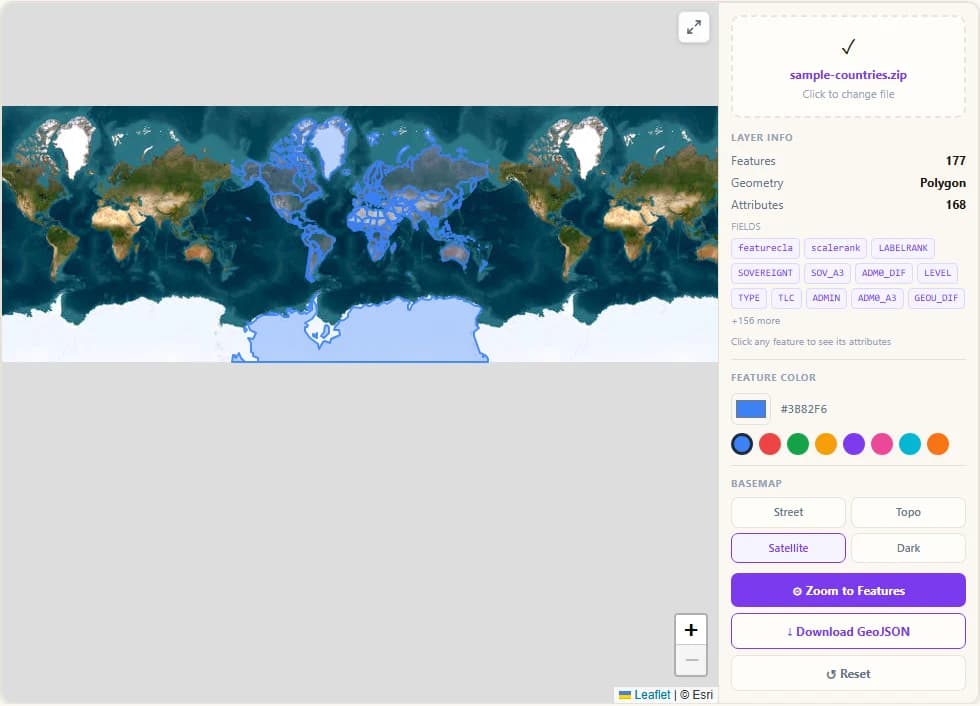
Satellite Imagery as Background
The Satellite basemap from Esri shows high-resolution aerial imagery. Overlay your shapefile on top to compare GIS boundaries against real-world land use, buildings, roads, and vegetation.
Step 8
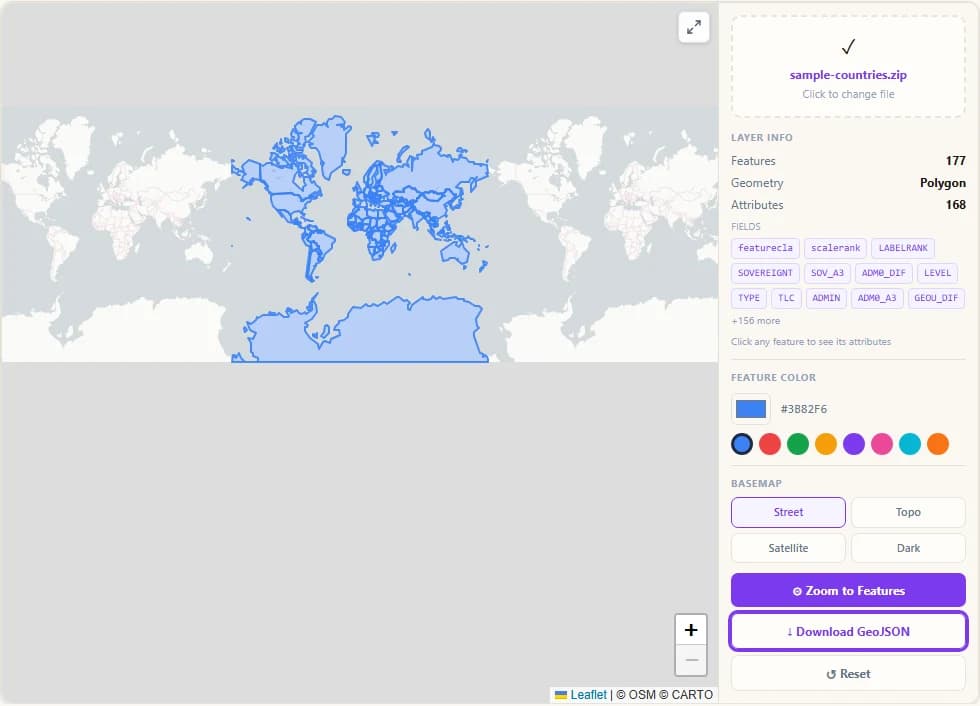
Export Features as GeoJSON
Click "Download GeoJSON" to export all shapefile features as a standards-compliant GeoJSON file. This is the easiest way to convert an Esri shapefile to GeoJSON format — useful for use in Mapbox, Leaflet, deck.gl, QGIS, or any modern GIS tool.
Step 9
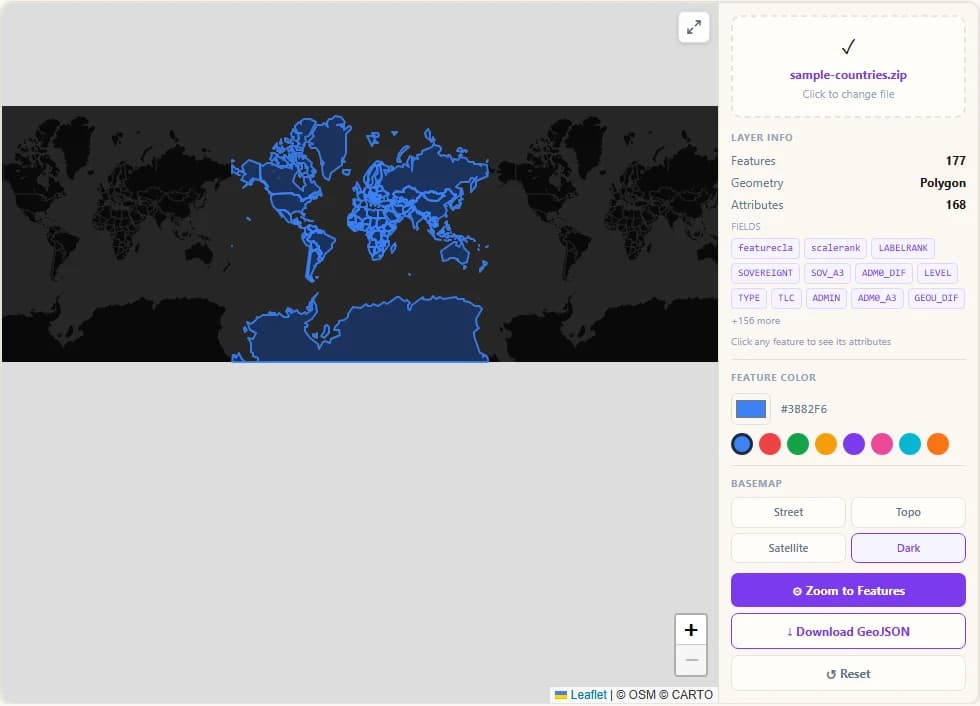
Dark Basemap for High-Contrast View
Switch to the Dark basemap for a high-contrast look that makes colourful feature overlays stand out vividly. The violet default colour pops particularly well against the dark background — ideal for screenshots and presentations.
Step 10
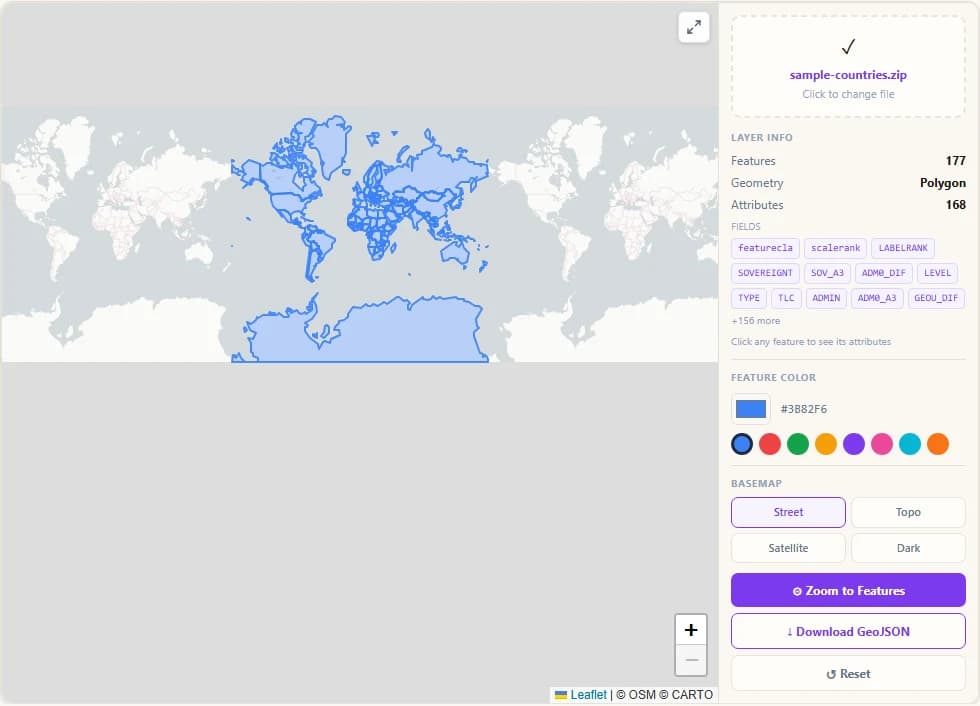
Zoom to Features Fits Map to Data
Click "Zoom to Features" at any time to snap the map back to the full extent of your shapefile data. Useful after you have panned away to explore surrounding areas or switched to a different basemap.
Related Tools
Map tiles © OpenStreetMap contributors, drawn with Protomaps (hosted by KONAKTIVE), with CARTO as the fallback. Topographic map: OpenTopoMap. Satellite imagery: Esri. Shapefile reading: shpjs. Map rendering: Leaflet. Your files are read in your browser and are never uploaded to a server.